2nd Time Activities with Wick

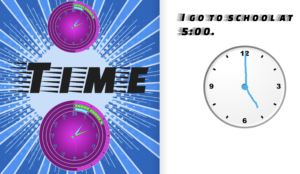
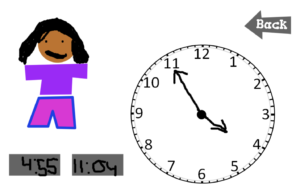
Second graders at Laburnum Elementary are learning how to tell time to the nearest five minutes (SOL2.9), so today students in Ms. Brouillard’s class created time activities with Wick. First, I showed the students a sample and explained that each button works with code. If you click the button with the correct time, the character turns happy, but if you click the button with the wrong time, the character turns sad. The Back button returns the character to its normal, beginning state. I explained that the students will be able to customize their own character, clock, and buttons. They could even customize the code, if they wanted. Wick is a powerful coding tool, and one thing I really appreciate is that it doesn’t require a login, which is very important for elementary students. Once they entered the website, I instructed the students to click the “Open” button in the top right corner and upload the template that I gave them. The template has a blank clock face, a simple character, a back button and two buttons with 0:00 on them for the two choices. The students used the drawing tools to draw hands on the clock, and I challenged them to pick a difficult time, instead of an easy one. Then they put the correct time on one button and an incorrect time on the other button. I explained that they should try to make the incorrect one “believable” by choosing a time that another student might guess, based on common mistakes (switching the hands, for instance). They could also move the buttons around and change their color by clicking on them. The students also double clicked the character to reveal three instances of it, and they used the drawing tools to make the first one look normal, the second one look excited and the third one look sad. Finally, they tested their projects to make sure they worked correctly and exported them as HTML files. I uploaded them to my website where you can see some student examples here.


Tags:


2nd Grade Time Books

Second graders at Holladay Elementary have been learning about time (SOL2.9), so today students in Ms. Fournier’s class created a Time book with Book Creator. First we practiced telling time to the nearest five minutes with an analog clock online (other ones are here and here). We discussed the difference between AM and PM and the activities they would be doing at the different times. Next we went to Book Creator, and I showed them how to use the various tools: text, drawing, recording, camera and image search. I explained that they could use any of the tools they wanted to create their book. Each student made a title page with the word “Time” and a photo or two of clocks. For the next page, I gave them an image of a blank clock face that they could upload to their books. Then they used the drawing tools to draw a minute hand and an hour hand on it. They also typed a sentence telling the time and what they would be doing at that time. I encouraged the students to add extra pages to their books if they had time. One cool feature of Book Creator is the “Read to me” button at the top right. If you click it, a computer-generated voice reads the book aloud. This is a great feature to help students proofread their writing because they will hear when the voice reads something that doesn’t sound right. Finally, after the students finished their individual pages, I combined them all together into one class book that you can see here.


Tags:


5th Grade Geometry with Scratch

Fifth graders at Trevvett Elementary have been studying angles (SOL5.12) and triangles (SOL5.13) in Math, so today students in Ms. Capano’s class created Scratch activities to review these concepts. First I showed them a sample using the new text-to-speech feature. I explained that there were several different voices they could choose from. Mine uses the Spanish female voice. I pointed out that they could click the “See Inside” button on my sample if they needed help with their code. Next the students logged into their Scratch accounts and chose a background and a sprite, or character. On the background, the students drew their angle or triangle with the drawing tools. They also used the drawing tools to create three costumes for the character: a neutral one for asking the question, an excited one for the right answer, and a sad one for the wrong answer. Then we started working on our code. I taught them how to turn on the text-to-speech feature by clicking the “Add Extension” button on the bottom left. The students added code to ask the user’s name and save it as a variable so they could include it in their responses. Variables are another concept fifth graders learn about in Math (SOL5.19). We also added an “If-Then” code so that if the answer was right, it would change costumes and give an excited response, but if it was wrong, the costume would change to the sad one and give an encouraging response to keep trying. You can take a look at some of their projects here. Be sure to turn up your volume because they do have voices!


Tags:


3rd Grade Fractions Animations

Third Graders at Trevvett Elementary have been learning about fractions in Math (SOL3.2), so today students in Ms. Peay’s class created fraction animations with BrushNinja. First we discussed fractions of a group and viewed various examples. Then we discussed how we might illustrate these types of fractions with animations. The students had some great ideas: a group of oranges that progressively rotted, a candy bar being eaten in sections, a bunch of ice cream cones melting one-by-one. We went to BrushNinja, and I instructed the students to draw their group of objects at the beginning when they all looked the same. I asked, What fraction would this represent? Since the animation is showing the fraction that had changed, we figured that we should write the fraction as 0/total. To save time, I showed them how they could duplicate the drawing, make a change to one object in the group, write the fraction, then continue that process until all the objects had been changed and the final fraction was total/total. Or as another option, students could redraw the picture in each successive frame with the changes and the new fractions. The final projects turned out great. You can see them here.


5th Grade Angles & Variables

Fifth graders at Laburnum Elementary have been studying angles (SOL5.12) and variables (SOL5.19), so today students in Ms. Burgess’s class used Scratch to review both of these concepts. First we signed into Scratch and clicked “Create” to start a new project. I showed them how to delete the cat and choose a new sprite, or character, from the library. Next, we clicked on the background tab, and I instructed them to draw an angle using the line tool. Our plan was for the character to ask a question about the angle, and if the answer is correct, the character will get happy, but if the answer is wrong, the character will be sad. I explained how to click the Costumes tab and design three costumes for their character: normal, happy, and sad. We also changed the names of each costume at the top so that we could identify them in our code. Now it was time for coding! We programmed the character to ask the user’s name, save their name in a variable, and use their name later in the responses. You can see some student projects here (and if you click “See Inside” you can look at the code they used).


Tags:


1st Grade Fractions with LogoMakr

First graders at Laburnum Elementary have been learning about fractions (SOL1.4), so today students in Ms. Mackenzie’s class used Logomakr to create their own fractions. Logomakr is a great webtool for elementary students – it’s easy to use, there’s no sign in, it has a huge library of clipart, and you can save your images with a link or as a downloadable PNG file. For this lesson, I created a template you can see (and use) here. To create a template, just design your task in LogoMakr, then save it and copy the link. When students click on the link and make changes, it generates new links for their projects, so your template is not changed. First, I showed them how to change the colors of the shapes to create their own fractions. Then, I demonstrated how to double-click on the fractions to change the numerator and denominator to match their illustration. Finally, we used the clipart search feature to make our own fractions. Students found a clipart image they liked, copied and pasted it several times to make a group, then changed the color of a few items and typed the fraction of the colored ones compared to the whole. You can see some student examples here.


Digital Citizenship Presentation

Our county is switching over from a digital citizenship curriculum that our team developed to Common Sense Media’s digital citizenship curriculum. It’s a great curriculum with lesson plans, videos, games, and activities. This week I have been giving presentations at each of my schools explaining how to use the new curriculum. First we said good-bye to the old curriculum, and then I went through the process for adapting the new curriculum. We discussed the eight topics of digital citizenship: communication, privacy security, internet safety, cyberbullying, self image, digital footprint, information fluency and copyright. You can take a look at my presentation here.


Kindergarten States of Matter

Kindergarten students at Holladay Elementary are learning how to write their names and other words (SOL K.10), and they are studying the states of matter in Science (SOL K.4). Today, students in Ms. Edelblut’s class drew pictures of solids, liquids, and gasses and they typed the words. First, we went to ABCYa! Storymaker and typed our names. I showed them how to use Shift to make a capital letter. Then we discussed different examples of solids, liquids, and gasses. I taught them how to use the paint brush tool to draw each of the three states of matter and how to use the text tool to type the words. Finally we clicked the lines in the top right corner and chose the save icon to download a PDF of our creations. You can look at some student examples here.


3rd Grade Water Cycle Animations

Third graders at Holladay Elementary have been learning about the water cycle (SOL3.7), so today, students in Ms. Szyperski’s class used BrushNinja to create animations illustrating the water cycle. First, we discussed each step in the cycle: evaporation, condensation, precipitation, and runoff. We also talked about different ways to illustrate each one creatively. I showed them how to use the text tool in BrushNinja to label each step and how to copy the frames at the bottom to save time. When they were finished, they exported their projects as animated GIFs and posted them on Schoology to share with their classmates. They turned out great! You can see some student examples here.


4th Grade Battlefield Perimeter & Area

Fourth graders at Trevvett Elementary have been learning about perimeter and area in Math (SOL4.7) and Civil War battles in History (VS.7b). Today students in Ms. Reed’s class used Google Maps to find the perimeter and area of Manassas Battlefield, where the Battle of Bull Run was fought in 1861. It was the site of the first major battle of the Civil War, and it’s now a national park. First, we explored it with regular Google maps so we could take a virtual field trip there. We turned on satellite view (bottom left corner) and clicked the yellow guy in the bottom right corner (also known as Pegman). When you click on him, you will see blue lines and blue dots. The blue lines show street view, but the blue dots give you a 360 degree view of those sites. Sometimes they are even inside of buildings and museums! So Pegman is a fantastic way to take virtual field trips (TIP: Try dragging Pegman over Hawaii or Nevada, and see what he turns into)! After exploring the battlefield in Google Maps, I asked the students to estimate its perimeter and area. I explained that in the next step we would actually measure its perimeter and area and see whose estimate was closest. My Google Maps is a great way to create, customize and save your own maps. To get started, we clicked the red button “Create a new map.” In the search box we typed “Manassas Battlefield” and arrived at the site. Then I showed them how to use the drawing tool to outline the battlefield. It took a bit of practice, but once the outline was complete, we gave it a title, typed a description, added a photo or two, and hit the Save button. When we clicked back on the outline, a box popped up with some cool features. We could change the outline and fill color with the paint bucket, but more importantly, it told us the area and perimeter of the outline! To finish the project, we clicked the Share button, changed the settings so anyone with the link could view the map, copied the link, and pasted it into Schoology. The students also typed the perimeter and area into the comments so they could compare their findings with their classmates’. You can see some of their maps and comments here.