Category: Social Studies

1st Grade Maggie Walker Research

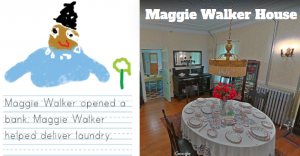
First graders at Pemberton Elementary have been learning about two famous Virginians Maggie Walker and Arthur Ashe (SOL1.3d,e), and they have been learning how to conduct research (SOL1.14). So today, students in Ms. Hutton’s class researched Maggie Walker and shared their findings using ABCYa! StoryMaker. I showed them how to use the microphone feature on Google to ask any questions they had about Maggie Walker. It was great listening to all their curious questions! One student’s question even led to an interesting discovery for all of us. He asked, “Did Maggie Walker have a car?” We found out that she did, in fact, sell her horse and carriage to purchase an electric car in 1910. Wow! I didn’t even realize they had electric cars in the early 1900s. There’s a fascinating article about it here, if you’d like to learn more. I love it when students teach me things! We also took a virtual field trip to Maggie Walker’s house, right here in Richmond, using Google Maps. When we dragged the yellow street view man to her house, we realized that we could even explore inside her home (see photo)! After learning so many amazing things about Maggie Walker, we went to ABCYa! StoryMaker and typed complete sentences about her, using capitals and periods (SOL1.13). Then we drew a picture of her with the drawing tools and shared our reports on SeeSaw. You can see them all here.


4th Grade Animated Famous Virginians

Fourth graders at Varina Elementary have been learning how to use online, reliable resources for research (SOL4.9), and they have been studying famous Virginians (VS.9). So today students in Ms. Belcher’s and Ms. Connell’s classes used this website to choose a famous Virginian and discover some interesting facts about them. Since we would be drawing our person, we did a Google image search for them to see what they looked like. We looked at their hairstyle, their clothing, and whether or not they wore glasses or facial hair. Next, we navigated to a great animation tool called BrushNinja. It’s free and doesn’t require a login. I explained that animation is basically a series of still pictures that are played one after another, kind of like the flip pages in Captain Underpants books. We drew our person on the first page, then duplicated the page several times and changed the mouth and the eyes in each image, so it looked like they were talking when we hit the play button. Before we exported our animation, we clicked the settings button at the top (the gear icon) to remove the background and slow down the frames per second. Then we saved our animation as a GIF file. The second step was to record audio of the person telling about their accomplishments using another great, easy-to-use web tool called Vocaroo. We downloaded the recording as an MP3 file. The final step was to combine the animation and the audio into a Google slides presentation. A new feature of Google slides is the ability to add sounds, but you have to save the MP3 files in a shared Google folder. I showed the students how to create a folder in their Google drive, share it, and upload the MP3 file into it. Finally, we made a Google slide, added a background image that related to our person, and uploaded the animation and sound files. They turned out really great! You can see them all here.


5th Grade Midwest Region Math

Fifth graders at Laburnum Elementary have been exploring the midwest region of the United States in Social Studies, and they have been learning about perimeter and area in Math (SOL5.8). So today, students in Ms. Hall’s class used My Google Maps to find the perimeter and area of a midwestern state and create a brief state report. First, we reviewed the states in the midwest region: Illinois, Indiana, Iowa, Kansas, Michigan, Minnesota, Missouri, Nebraska, North Dakota, Ohio, South Dakota, and Wisconsin. The students chose one they found interesting and researched it online to make sure it was the state they wanted to do. Next, we went to My Google Maps and clicked “Create a New Map.” We changed the title to the name of our chosen state. Then I showed them how to use the drawing tool to draw an outline of the state. I also showed them how to customize the line thickness and the fill color (after you save the shape, click the paint bucket tool). One of the cool features of My Google Maps is that it shows you the perimeter and the area of any shape you draw. So the students typed the perimeter and area of their state in the pop-up information box, with the correct units: miles and square miles. They also added some of the facts about their state that they discovered in their research. We clicked the camera icon to add a few photos of our state. Finally, with the extra time we had at the end, I demonstrated how they could search for their school and put a pin on it. The pin can be customized, as well, by clicking the paint bucket tool. We shared our maps so anyone with the link could view them, and we pasted the links in Schoology. You can see some of their projects here.


4th Grade Battlefield Perimeter & Area

Fourth graders at Trevvett Elementary have been learning about perimeter and area in Math (SOL4.7) and Civil War battles in History (VS.7b). Today students in Ms. Reed’s class used Google Maps to find the perimeter and area of Manassas Battlefield, where the Battle of Bull Run was fought in 1861. It was the site of the first major battle of the Civil War, and it’s now a national park. First, we explored it with regular Google maps so we could take a virtual field trip there. We turned on satellite view (bottom left corner) and clicked the yellow guy in the bottom right corner (also known as Pegman). When you click on him, you will see blue lines and blue dots. The blue lines show street view, but the blue dots give you a 360 degree view of those sites. Sometimes they are even inside of buildings and museums! So Pegman is a fantastic way to take virtual field trips (TIP: Try dragging Pegman over Hawaii or Nevada, and see what he turns into)! After exploring the battlefield in Google Maps, I asked the students to estimate its perimeter and area. I explained that in the next step we would actually measure its perimeter and area and see whose estimate was closest. My Google Maps is a great way to create, customize and save your own maps. To get started, we clicked the red button “Create a new map.” In the search box we typed “Manassas Battlefield” and arrived at the site. Then I showed them how to use the drawing tool to outline the battlefield. It took a bit of practice, but once the outline was complete, we gave it a title, typed a description, added a photo or two, and hit the Save button. When we clicked back on the outline, a box popped up with some cool features. We could change the outline and fill color with the paint bucket, but more importantly, it told us the area and perimeter of the outline! To finish the project, we clicked the Share button, changed the settings so anyone with the link could view the map, copied the link, and pasted it into Schoology. The students also typed the perimeter and area into the comments so they could compare their findings with their classmates’. You can see some of their maps and comments here.


3rd Grade Famous Americans Elasped Time

Third graders at Trevvett Elementary have been reviewing famous Americans in Social Studies (SOL2.4) and learning about elapsed time in Math (SOL3.9b). So today students in Ms. Peay’s class created comics about famous Americans and the elapsed time of their well-known activities. First we talked about some possible activities and their duration. For example, how long would it take Cesar Chavez to work in the fields? How long would it take for Martin Luther King, Jr. to give a speech? How long would Rosa Parks ride in the bus? Then we discussed two different ways to ask about elapsed time: we could give the start and end times and ask about the duration, or we could give the start time and the duration, and ask about the end time. Once they planned out what they wanted to do, the students went to StoryboardThat, which is a great tool for making comics. They created comics with three panels. The first two panels had to give information about the person, their activity, and the times, while the last panel had to ask the reader a question about elapsed time. We posted our comics on Schoology, and our classmates had to reply with the answers to our questions. You can see some student samples and their comments here.


Tags:


3rd Mali Matter Comics

Third graders at Varina Elementary have been learning about the Empire of Mali in Social Studies (SOL3.4) and matter in Science (SOL3.3). So today students in Ms. Goode’s and Ms. Lanham’s classes created Mali Matter comics. First we reviewed different aspects of the Mali Empire: griots, camels, salt, gold, Timbuktu, the Niger River, etc. and categorized them as solids, liquids, or gasses. Since we didn’t identify too many gasses or liquids, the students had to be creative (and they were!). Now that they had some ideas for their comics, we went to StoryboardThat, which is an online tool for making comics. We made a 3-panel comic, and in each panel the students had to provide an example of a solid, liquid, or gas from the Mali Empire. In order to find the most accurate illustrations, we looked at online images of the Mali landscape and the clothing people wore there a long time ago. Then we looked in StoryboardThat for Scenes and Characters that were similar. Students also added speech bubbles to explain the types of matter in their comic. You can see some student samples here.


Tags:


3rd Grade Perimeter & Ancient Architecture

Third graders at Trevvett Elementary have been learning about ancient civilizations in History (SOL3.3) and how to measure perimeter in Math (SOL3.8a), so today, students in Ms. Robinson’s class measured the perimeter of the Parthenon and the Colosseum with Google Maps. First, we explored both structures in Google Earth. Google Earth is an amazing tool that not only allows you to view buildings in 3D, but you can actually look around inside them with 360 photos (click the little man icon in the lower right corner, then click on a blue dot near a building). As we explored each building, we estimated their perimeters. Next, we went to My Google Maps. Google Maps has a different set of features that allows you to create and save your own custom maps. We located the Parthenon and the Colosseum and placed a marker on each one using the marker tool. I showed them how to customize the pin by typing information, adding a photo, changing the pin color, and adding an icon. Then we used the shape tool to draw a shape around the perimeter of each building. Shapes can be customized as well, using the paint bucket tool to change their color, border size and transparency. Once the “Save” button is clicked, the perimeter and area of the shape can be found in the bottom of the pop-up box. Students compared their earlier estimates with the actual measurements. Finally, we published our maps and shared them on Schoology. You can see them all here.


4th Grade Flipgrid Debate

Fourth graders at Trevvett Elementary have been studying life in colonial Virginia (VS.4), and they have been learning how to conduct research (SOL4.9) and express an opinion supported by facts (SOL4.7j). Today we reviewed and practiced these concepts with a Flipgrid Debate. Knowing how to have a civil debate is an important citizenship skill which can be taught, even in elementary school. This article in Edutopia explains how oracy, or speaking well, can serve our students for the rest of their lives. Oral communication is the first of the English SOLs for every grade (K.1, 1.1, 2.1, etc.), but we are often at a loss for how to teach it. Voice21 provides great resources and rubrics for teaching oral communication to elementary students. I will be presenting on this topic at VSTE2018 if you’d like to learn more about it. My presentation is here. One fun, unstressful way for students to practice public speaking is to record videos, which is why we are using Flipgrid. Most of them have their favorite YouTubers, so they have some background knowledge about good public speakers. We discussed how those YouTubers speak with enthusiasm and expression and share interesting information. Then I gave the students a debate topic: “Life in Colonial Virginia was better than life in modern Virginia.” I explained that they would choose a side, pro or con, and defend their position with facts. We spent a few minutes researching facts about colonial Virginia on the Internet. Students copied the URL for the website they found most useful. Then, when we recorded our videos in Flipgrid, they clicked the button for attaching links, and pasted in the URL as a citation. Some of the sites the students found were: 1, 2, 3, 4, and 5. Flipgrid videos use snapshots for the video thumbnails, so I instructed students to show their pro or con position visually in the snapshot with an emoji or thumbs up or down. Next, they had to find someone who held an opposing position, listen to their argument, then record a counterargument as a reply. We reviewed ways to disagree politely and with a respectful attitude. Even though this was their first debate, they did a great job! You can take a look at their videos here.


Tags:


5th Grade Southeast Region Facts & Opinions

Fifth graders at Trevvett Elementary have been learning about the southeast region of the United States in Social Studies and facts and opinions in Reading (SOL5.6i). Today, students in Ms. Brown’s class created an interactive webpage with facts and opinions about a southeastern state. We used a fantastic new site called Wick that teaches coding in a simple but powerful way. First, the students chose a state in the southeast region to research. As they gathered information, I instructed them to download a map of their state to use in their project. Next, we went to Wick and clicked “Launch Editor.” We uploaded our map, used the drawing tools to create a character, and added two buttons for “Fact” and “Opinion.” To make a button in Wick, we selected the shape(s) and chose the “button” tool. We also grouped our character together (by dragging across all the parts) and turned it into a button. One of the most powerful features of Wick is the ability to give each button its own timeline that can be triggered with code. So we added new frames to our character’s timeline (by clicking it twice and clicking the + in the timeline) and added a stop(); code to each frame using the Javascript “JS” button. Without the stop code, the timeline would play and loop automatically, which is great for animation, but not for our activity. We typed an opinion about our state in one frame and a fact about our state in the other frame. Then went back to the main page and added code to each button to go to the correct frame. For example, our code on the “Opinion” button would go to the 2nd frame of the character’s timeline:

function mouseDown() {
character.gotoAndStop(2);
}

You can see that it is real JavaScript, but the students don’t have to type it all. They click the code snippets from the left panel, and it fills in automatically. Finally, the students checked their code by pressing the “Run” button. If everything worked, we exported it as an HTML file. You can see all their webpages here.


Tags:


1st Grade Jamestown Comics

First graders at Trevvett Elementary have been learning about Jamestown in History (SOL 1.1c, 1.2a, 1.3abc). This is a new SOL for first grade (it is also taught in 4th grade), so many teachers are eager for new ideas. Today, I showed Ms. Burnett’s class how to use StoryboardThat to create Jamestown comics. We visited the site and clicked the “Create” button. The default comic has three panels, which was perfect since the students need to know three important people from Jamestown: Powhatan, Pocahontas, and Christopher Newport. First, we clicked Scenes > US History to find backgrounds relating to Jamestown. After the students added the scenes to each frame, they clicked Characters > 1600s to 1800s and added people who looked like Jamestown colonists and Powhatan Indians. Then we clicked Textables to add speech bubbles to each person. First graders are learning how to write complete sentences with capitals, punctuation, and correct spelling (1.13), so we practiced those skills as we typed in the speech bubbles. I encouraged the students to include facts about Jamestown in their sentences. Finally, we published our comics and shared the links on Schoology. You can see some examples here. (UPDATE: In Math, 1st graders are are learning about place value, so we did a similar Jamestown comic with another class, but this time the characters talked about place value).


Tags: