Category: 3rd Grade

3rd Grade Moon Cycle Animations

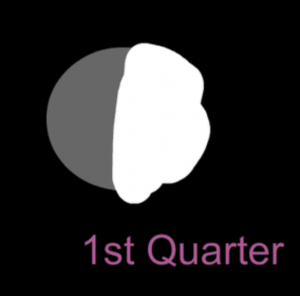
Third graders at Trevvett Elementary have been learning about moon cycles in Science (3.8a) and multiplication in Math (SOL3.5). Today students in Ms. Bae’s class solved multiplication moon problems and created their own moon cycle animation with ABCYa! Animate. First, I posted a discussion on Schoology with an animated image of the phases of the moon so they could get an idea of the type of animation they were going to create. I pointed out that the light starts on the right side and advances over to the left side of the moon. We reviewed the four phases: first quarter, full moon, last (or third) quarter, and new moon. We also talked about why they were called quarters when they look like halves (the moon is always half light and half dark but the cycle is divided into four parts, or quarters). The discussion question stated: “You have learned that the moon goes through four phases in about one month. How many phases would it got through in __ months? Insert your own number in the blank and solve the problem.” Students were able to review their knowledge of multiplication and the moon while using the discussion feature for the first time. Next, we went to ABCYa! Animate, and I showed them how to create a picture of the new moon by creating a black background and adding a grey circle. We used the Text Tool to type “New Moon.” Then we made a copy of the picture with the Copy Cat button. We typed “1st Quarter” and painted the right half white. We continued in this manner, making copies and adding details, until all four phases were illustrated. Finally, we turned on Looping and pressed the Play button. The students loved seeing their own animated moon cycle! We shared the exported GIFs in a Schoology album, but you can see them all here.


3rd Grade Matter Transitions

Third graders at Varina Elementary have been learning about matter and how it changes states from solid to liquid to gas and back to solid again (SOL3.3). Today students in Ms. Galvin’s, Ms. Long’s, and Ms. Hummel’s classes used Google slides and Scratch to show different types of matter changing states. Ms. Hummel’s class focused on water in their Google slideshows. We used the Transitions feature to animate pictures of water fading from solid ice to liquid or from liquid to water vapor. Ms. Galvin’s and Ms. Long’s classes chose different types of matter that can melt and freeze (like chocolate, ice cream, and Popsicles). First, they drew two costumes for their object (the solid state and the liquid state). Then they added code so that clicking the object changes its state, or costume. Some students also added code for their objects to “say” a fact about the state of matter. When their projects were finished, we published them online and shared the links on Schoology. You can see them all here.


3rd Grade Multiplication Arrays

Third graders at Laburnum Elementary have been learning about multiplication arrays (SOL3.6), so today students in Ms. Forrester’s class created videos explaining multiplication arrays with Educreations. First, we reviewed arrays and how to use them to solve a multiplication problem. I pointed out that they probably wouldn’t want to make a big array (like 12×12) because they will need room on their picture to explain each step. Next, we went to ABCYa! Paint to create the array since it has some cool stickers (robots, monsters, cupcakes, etc) they can use. I reviewed the importance of aligning the groups neatly. When they finished, we imported the image into Educreations and recorded ourselves counting the groups and explaining how many were in each group. Finally, we wrote the multiplication problem and solved it. Each student posted the link to their video in Schoology, but you can see them all here. (I taught a similar lesson with Ms. Kazlau’s class at Trevvett where we used ABCYa! Animate. You can see those here).


3rd Grade Animal Habitats Graph

We’re on an animal habitats streak here! In previous posts I’ve shown how your habitats unit (SOL3.4) can reinforce the skills you are teaching in Social Studies and Reading. Now we’ll see how it can reinforce Math concepts as well. At Trevvett Elementary, third graders have been learning about graphing (3.17), so today students in Ms. Bae’s class practiced graphing animal’s habitats. First we had to collect some data. I used Fobio to convert a Google form into a chatbot to make the process a bit more interesting. You can try the chatbot out for yourself by clicking here. Once the students had entered their information, I took a screenshot of the results spreadsheet and posted it to Schoology (step 2 in the graphic accompanying this post). Next the students opened a blank Google spreadsheet and typed the habitats in Column A and the number of animals in Column B. I showed them how to use the new “Explore” feature by clicking the star shape in the bottom right corner. From the pop-up window they could change the colors of the rows and automatically add a bar graph (step 3 in the graphic). I explained that they could also change the colors of the bars by double clicking on one of them, then clicking the paint bucket in the pop-up window. The students shared the links to their spreadsheets on Schoology. You can see an example here. (UPDATE: The next day at Holladay, Ms. Haley’s class combined Math & Science by writing math word problems about animals. See them here).


3rd Grade Animal Nonfiction Books

Third graders at Varina Elementary have been learning about animals in Science and nonfiction text elements in Reading (SOL3.6c). Today students in Ms. Hummel’s class used Book Creator to design a nonfiction book about an animal. First the students chose an animal and did some quick research online to find interesting facts about their animal. Then they signed into Book Creator with the teacher’s class code (to get the code, teachers should click on their class library from the drop down menu and click “Invite”). Students chose “New Book” and clicked the i button to choose a color for their book. They added a title by clicking the + button and selecting “Text.” I demonstrated how to customize the text’s font, size, and color using the i button. Next, they added a photo of their animal using the built-in image search by clicking the + button and “Import.” We flipped to the next page and started typing facts. Since we wanted to include nonfiction text features like bold text, captions, and photos, I showed them how to make important words bold by highlighting them and clicking the “B.” Finally we created an “About the Author” page. Book Creator has a special feature that let’s students take photos and videos right within the app, so they added photos or videos of themselves. I combined all the books together in one book (click the “books” button, then “Combine books”). You can read it here (I did similar book projects today with 5th Grade Oceans and 4th Grade Weather).


3rd Grade Animal Rules & Laws

Third graders at Holladay Elementary have been learning about the difference between rules and laws in Social Studies (SOL3.10a), and they have been studying animal adaptations in Science (SOL3.4). So today students in Ms. Whittaker’s class created slideshows that identified animal adaptations and also included a rule or a law about that animal. First they opened a blank Google slideshow, and I showed them how to add a background image of their animal. Next we added some shapes to point out different features on the animal (Example – deer have antlers to fight with). If the students needed to do some research, they could open a new tab and do a quick Google search. I demonstrated how to change the color and type a fact in each shape. Then we added another shape and typed in a rule or a law about the animal (Example – Rule: Don’t feed the deer; Law: You can only shoot two deer with antlers per season). Finally, we used the Transitions button to add animations to the shapes. Students shared their slideshows on Schoology, and you can see them all here.


3rd Grade Shapes in Virtual Reality

Third graders at Trevvett Elementary have been learning about plane and solid geometric figures (SOL3.14). Today, students in Ms. Hufnell’s class used our new resource, CoSpaces, to create a virtual reality world of 3-D shapes to explore. First, we logged into CoSpaces with our Google accounts, then we created a new space. I showed them how to click the Environment button in the bottom left corner to choose a background image (you can also upload 360 degreee photos). Next, we went to the image library and added a person. The students could customize the people by right clicking on them and changing their colors and poses. We added a speech bubble, and typed an introduction. Then we went back to the library and added a variety of solid figures. Using the right click, we changed the colors of the shapes and typed sentences describing them in speech bubbles. You can even use coding to program the shapes to be interactive. We didn’t have time to do that today, but here’s an example. Finally, we clicked the share button, copied the link, and pasted it into Schoology so we could explore each others’ virtual worlds. You can explore them yourself here.


3rd Grade Mali Comics

Third graders at Varina Elementary have been learning about the Empire of Mali (SOL3.2), so today students in Ms. Galvin’s class created comics about Mali using StoryboardThat. First we reviewed what they learned, and I wrote a word bank on the board: Africa, empire, Mali, gold, salt, trade, route, pilgrimage, Mansa Musa, Sundiata, Niger River, griot, Timbuktu, Sahara, etc. Next, we went to StoryboardThat, and I showed them how to search in the Scenes for background images that look like Mali. We compared the images from the American southwest desert with the ones of the Sahara Desert so they wouldn’t pick the wrong kind of desert. Next we searched the Characters for people that looked like the people of ancient Mali. I did a Google image search to show them how the people really dressed. I also demonstrated how to customize the characters by changing their skin colors and poses. Finally we added speech bubbles from the Textables, and students wrote complete sentences with facts about Mali. Since our students cannot have accounts (they are under 13), we saved our comics by taking screenshots using the Snipping Tool. Then we uploaded them to a shared Google folder so we could read each others’ comics. You can take a look at all of them here.


3rd Grade 3D Shapes on the Earth

Third graders at Laburnum Elementary have been learning about plane (2D) and solid (3D) figures in Math (SOL3.14). Today students in Ms. Ford’s, Ms. Forrester’s, and Ms. Collins’ classes found examples of these shapes using the new web-based Google Earth. Google Earth is pretty awesome, and this is attested by the Oooh’s and Ahhh’s I heard in every classroom as the students opened it up. Many of the cities are in 3D so it’s perfect for finding real-life examples of the 3D shapes (if you want to see which places are in 3D here is a downloadable KMZ file from the GEarth Blog). However, while rectangular prisms and cubes are fairly easy to find, other shapes like cones and spheres are more difficult. So I created a KMZ file that the students downloaded (you can download it here or see the map here). Then in Google Earth, the students clicked the gear (settings) to allow KMZ uploads and went to Bookmarks to upload my KMZ file. Now all the places were available to the students by clicking on the folder in their bookmarks (click the eye icon to make them visible or invisible). First we explored shapes in Richmond. The students were surprised to find out that there is a pyramid right here in Richond! I showed them how to take screenshots of the places they found and save them. Then I let them explore and try to find examples of each shape on their own. We uploaded our screenshots to a Padlet to share with our classmates. You can see them all here: Forrester, Ford, Collins.


3rd Grade Explorers Spreadsheet & Map

Third graders at Laburnum Elementary have been learning about the first European explorers in the New World (SOL3.5c,d). Today students in Ms. Burgess’ class learned how to enter data about the explorers into a spreadsheet and upload it into a Google map. I gave each student a copy of an “Explorers Spreadsheet” (you can make a copy of the spreadsheet here). The explorers’ names are already on the spreadsheet, but students had to do research to enter the remaining information – sponsor country, final destination, and length of trip. For the length of the trip, we first tried finding the mileage of the trip, but realized it was easier to find the length of the trip in days. We were surprised by what we discovered in our research because the lengths of the various trips were very different from our initial predictions. After we entered the data, we highlighted it all and clicked the graph button to make a bar graph. Next we went to “My Google Maps” and clicked the “Add Layer” button. We imported our spreadsheet from Google Drive and checked off “Sponsor” for the placemarks and “Explorer” for the label. Then Google maps automatically created the placemarks in the correct spots. To create an additional set of placemarks for the destinations, we repeated the steps above, but checked off “Landed” for the placemarks. Finally, students could customize the placemarkers by changing the colors and adding photos. You can see a sample spreadsheet here (they were all pretty much the same) and a sample map here.