Category: 3rd Grade

3rd Grade Fractions Book

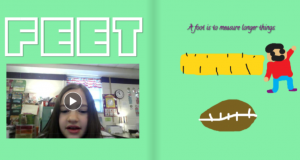
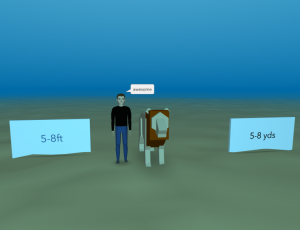
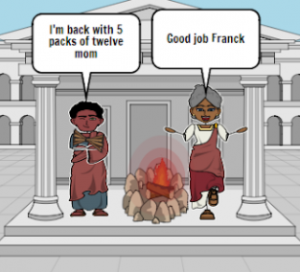
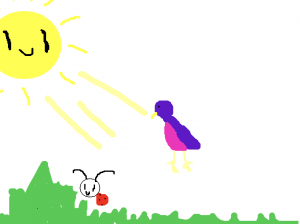
Third graders at Laburnum Elementary have been learning about fractions as parts of a whole and as parts of a group (SOL3.3). Today students in Ms. Forrester’s class made fractions books to show examples of each type using BookCreator. First, Ms. Forrester set up her account and gave the access code to her students. Once they were logged into her class, I showed them how to create a new book. We all picked the square size since we will be combining our individual books into one class book. On the cover of our book, we typed a creative title, picked a background color, and added our photo using the built-in webcam feature. On the next page, we illustrated a fraction as part of a group using the shapes tool. We made several shapes one color and other shapes a different color. Then we typed a sentence identifying the fraction. I asked them to illustrate a fraction as part of a group on the last page. They used the image search feature to find a photo of an object that could be divided into parts (food seemed to work well). Then they used the drawing tool to draw the parts and “cut out” some of them. They also typed a sentence identifying the fraction. This gave them practice using all the different tools BookCreator has available. Finally, the students published their books online and I combined them into a class book. You can read their book here. (UPDATE: I taught a similar lesson in Ms. Long’s class at Varina, and you can read their book here).


Tags:


3rd Grade Life Cycle Movies

Third graders at Holladay Elementary have been studying animal life cycles (SOL3.8b), so today students in Ms. Haley’s class researched an animal life cycle of their choice and created a video about it. I asked them to pick an animal they were curious about. To help spark their curiosity, I asked questions like: Do sharks lay eggs? What does a baby firefly look like? Do jellyfish go through metamorphosis? Once they had their ideas I gave them a few minutes to research online. We discussed reliable and unreliable websites: encyclopedias, museums, and science websites would be reliable, whereas a personal website or blog would be less reliable. I also explained how to tell the difference between real photos and fake photos. A real photo will have several examples that look similar. For example we did a search for “jellyfish eggs” (they don’t lay eggs) and found an image of a fried egg jellyfish (which isn’t quite what we were looking for, but it’s an actual thing). A better search phrase would be “life cycle of a jellyfish” (we discovered that its life cycle is quite complicated). After the students gathered their facts and photos, we logged into WeVideo with their Google accounts. We switched to Storyboard mode, which is simpler, by clicking the three lines at the top left. I demonstrated how to import their photos with the green cloud icon, and we changed the title of our video. Next, the students recorded an introduction using the webcam feature. We dragged our photos from the media folder down into the timeline and recorded a voiceover. Finally we selected a theme with music, turned down the volume of the music so it didn’t drown out our voiceovers, and published our videos. You can see them all here.


Tags:


3rd Grade Famous Americans Come To Life!

Third graders at Varina Elementary have been learning about famous Americans (SOL3.11b George Washington; Thomas Jefferson; Abraham Lincoln; Rosa Parks; Thurgood Marshall; Martin Luther King, Jr.; and Cesar Chavez;). Today, students in Ms. Long’s class used SitePal to make them come to life. First, the students chose one of the famous Americans to represent, and we made sure that each person was picked by at least one student. Next, we did some quick research to find some facts and pictures of the person. I instructed the students to find a photo that showed their face up close so we could use it in the animation. We downloaded the image by right clicking it and selecting “Save image as.” Then, we went to SitePal and clicked the Demo button. We uploaded our image and followed the site’s instructions to add special markers to the eyes, nose, ears, mouth, and chin. Once that was done, the students were surprised to see the famous American blinking and looking around! To add the voice, students clicked the TTS (Text to Speech) tab and typed some sentences with good facts from their research. SitePal has customized male and female voices to choose from that read the text aloud. Finally, we used the Screencastify Chrome extension to record our animation. It’s amazing how realistic and life-like they look! You can see all the videos here.


3rd Grade Measurement Books

Third graders at Holladay Elementary have been learning about U.S. Customary and Metric units of measurement for length, capacity, and mass (SOL3.9). Today, students in Ms. Whittaker’s class created their own interactive measurement ebook. First we reviewed the different units and each student selected one. We tried to make sure that most of the units were chosen and that there weren’t too many duplicates. Next, we signed into BookCreator with the teacher’s class code. On the first page each student typed the name of their unit and drew a picture of it with the drawing tools. On the second page, they typed a sentence explaining what kinds of things are measured with that unit–big things, little things, light things, heavy things, liquids, etc. We also recorded a video, but those had problems loading, so next time I would probably just add a photo. On the last page students used the built-in image search to add photos of objects that could be measured with the unit. When they finished, the teacher combined the individual student chapters into one book that you can read here. (UPDATE: I taught a similar lesson to Ms. Cathcart’s class at Varina, and you can read their book here).


Tags:


4th Grade Space Animations

Fourth graders at Trevvett Elementary have been learning about the causes of Earth’s seasons (SOL4.8b) and the phases of the moon (SOL4.8c) in Science. A great way to demonstrate understanding of these concepts is to create animations of the movements of the Earth and moon. That’s exactly what students in Ms. Towns’ class did today using ABCYa!Animate. First, we reviewed the four seasons and the eight phases of the moon with their respective vocabularies (revolution, orbit, rotation, axis, waxing, waning, gibbous, etc). We discussed the position of the Earth relative to the sun to cause the different seasons and the position of the moon relative to the Earth to cause the different phases. We also asked some questions to stir their curiosity… What season is it on the other side of the Earth? Do other moons have phases? Do other planets have seasons? Why does the same side of the moon always face the Earth? Does the Earth move clockwise around the sun? Does the moon travel counterclockwise around the Earth? Those last two questions are important for drawing the animations correctly (ANSWER: both move counterclockwise when looking down from above the orbit, but clockwise when looking up from below the orbit). Once we had our facts straight, we drew the first image of our animation. I instructed them to include a drawing of what phase or season is happening at that position. For the subsequent frames we copied the drawing, then moved or redrew the objects. When we finished all the steps, we turned on looping and slowed down the speed. Then we exported our animations and shared them on Schoology. You can see them all here. (UPDATE: I added some animations from Ms. Hirth’s 4th grade class at Holladay Elementary as well).


3rd Grade Loopy Cycles

Third graders at Holladay Elementary have been learning all about cycles: animal life cycles, plant life cycles, seasons, and the phases of the moon (SOL3.8). Today students in Ms. Ambrose’s class used a website called Loopy to demonstrate how one of these cycles works. First we reviewed the steps in each cycle and pointed out that most of them have four parts. The students could choose which cycle they wanted to illustrate. I explained that a cycle is kind of like a circle because it continues around and around. Then we went to Loopy and I showed them how to create each step of the cycle by drawing circles and labeling them. The students could also change the colors of each circle. Next, we drew arrows to show the order and relationships between each step. We discussed why the order was important. Could the steps happen out of order? The way Loopy works is you click up or down arrows in each circle and see how having more or less of that part influences the other parts (it was designed to study simulations). So it illustrates life cycles best. If there are more eggs there will be more butterflies or frogs, but if the number of eggs goes down, so does the number of adults. You can change the relationships, too, by making the arrows positive or negative. That would be great for illustrating food chains and food webs (if there are more predators, there would be less prey – a negative relationship, but if there are more prey, there would be more predators – a positive relationship). When we were finished, we published our Loopy projects, and it provided a link to shorten with Bit.ly. We shared our links on Schoology, but you can see them all here.


3rd Grade Plant & Animal Measurements

Third graders at Varina Elementary have been learning about plants and animals in Science (SOL3.6) and about measurement in Math (SOL3.9). Today students in Ms. Hummel’s class created a 3-D scene where the visitor can estimate the measurement of a plant or animal, and check their answer. First, we created the 3-D scene using CoSpaces. I showed them how to choose a background with the Environment button and add objects with the Library button. Since there is a limited number of plants and animals in the Library, the students had to choose one of those to measure. Next, they opened a new tab and searched the Internet for the plant’s or animal’s actual measurements. Back in CoSpaces, they added two panels from the Library and typed the correct measurement on one panel, and a different measurement on the other (maybe with a different unit or amount). I showed them how to right click on the objects in the scene and activate them to be used in Blockly (the coding language). Finally, we clicked the code button and programmed the objects so that when the visitor clicks a panel, something lets them know that they are right or wrong (maybe a person says something or an object turns a color). The student’s posted the links to their scenes on Schoology for their classmates to explore, but you can see them all here.


Tags:


3rd Grade Greece & Rome Multiplication Comics

Third graders at Varina Elementary have been studying multiplication in Math (SOL3.5), and they have been learning about Greece and Rome in History (SOL3.1). Today, students in Ms. Lanham’s class used StoryboardThat to create comics about Greece or Rome with a multiplication problem to solve. First, we reviewed the concept of multiplication. It is repeated addition of the same number, or it can be thought of as equal groups. Next, we discussed life in ancient Greece and Rome and brainstormed some possible multiplication problems. Farmers may have problems dealing with the number of grapes or olives they can grow in equal rows or put into jars. Shipbuilders may have to solve how many people can fit in each boat. Priests may have to figure out how many designs are on each column of the temple. Once we had our ideas, we went to StoryboardThat, and I showed them where they could find Greece and Rome backgrounds (Scenes > Historical, Rustic, or Outdoor). There are also Greece and Rome people in Characters > Classical Era. Finally, they added speech bubbles (Textables) to explain the multiplication problem in their comic. The first panel might explain how many items are in each group. The second panel might explain how many equal groups there are in all. The third panel could ask about the total number of items. We took screenshots of our comics and shared them in a Schoology discussion so we could solve each other’s problems. You can see them all here. If you’d like to see more examples, I also taught this lesson to Ms. Cathcart’s and Ms. Haley’s classes.


Tags:


3rd Grade Coding a Food Chain

Third graders at Holladay Elementary have been learning about food chains (SOL3.5), so today students in Ms. Whittaker’s class created an animated food chain using code in Scratch. First, we reviewed the different types of aquatic and terrestrial food chains, and we discussed how all food chains start with the sun. Next, I helped the students set up their Scratch accounts. We started a new project, deleted the cat sprite (the default character), and I showed them how to draw their own sprites. They drew a sun, a plant, an animal to eat the plant (an herbivore), and an animal to eat that animal (a carnivore). Since it was going to be animated, they also drew several costumes for each sprite. For example, their sun sprite had costumes showing the rays shining down on the plant, and their plant sprite had costumes showing how it was being eaten. Finally the students added code to each sprite. The sun code looped through the costumes so it repeatedly sent rays to the plant. The other sprites’ codes programed them to move and cycle through the costumes at different time intervals, making it look like they were eating and getting eaten. We shared our project links on Schoology, but you can see them all here.


Tags:


3rd Grade 3-D Animal Reports

Third graders at Holladay Elementary have been studying animals and their habitats in Science (SOL3.4, 3.5, 3.6). They have also been learning about how to write research reports in Language Arts (SOL3.11). Today students in Ms. Ambrose’s class researched an animal of their choice with PebbleGo and created a 3-D report using CoSpaces. First, students selected an animal and used PebbleGo to find out about its habitat and its design, or adaptations. We discussed whether PebbleGo is a reliable website (it is :). Next, we logged into CoSpaces with our Google accounts, and I showed them how to choose a background image that looked like the animal’s habitat. Then we searched for a 3-D model of our animal (or an animal that looked similar). I explained that they can change the color of their animal by right clicking on it. They also needed to use the right-click to make the model accessible in Blockly (the coding language). We wanted to code the animal to speak about itself and share the facts we learned, but before we could do that, we had to record ourselves. We used Vocaroo to record and save an MP3 file (you could also use Audacity). We uploaded the file to CoSpaces using the Upload button. Finally, in Blockly, we added a few bits of code to make the animal speak when you click on it. Some of the students even added code to make the animal move. We published our projects and shared the links on Schoology. You can see them all here.