Category: 3rd Grade

3rd Grade Perimeter & Ancient Architecture

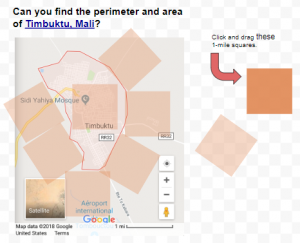
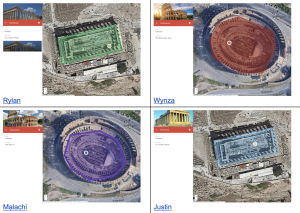
Third graders at Trevvett Elementary have been learning about ancient civilizations in History (SOL3.3) and how to measure perimeter in Math (SOL3.8a), so today, students in Ms. Robinson’s class measured the perimeter of the Parthenon and the Colosseum with Google Maps. First, we explored both structures in Google Earth. Google Earth is an amazing tool that not only allows you to view buildings in 3D, but you can actually look around inside them with 360 photos (click the little man icon in the lower right corner, then click on a blue dot near a building). As we explored each building, we estimated their perimeters. Next, we went to My Google Maps. Google Maps has a different set of features that allows you to create and save your own custom maps. We located the Parthenon and the Colosseum and placed a marker on each one using the marker tool. I showed them how to customize the pin by typing information, adding a photo, changing the pin color, and adding an icon. Then we used the shape tool to draw a shape around the perimeter of each building. Shapes can be customized as well, using the paint bucket tool to change their color, border size and transparency. Once the “Save” button is clicked, the perimeter and area of the shape can be found in the bottom of the pop-up box. Students compared their earlier estimates with the actual measurements. Finally, we published our maps and shared them on Schoology. You can see them all here.


3rd Grade China & Egypt Multiplication

Third graders at Holladay Elementary have been learning about ancient Egypt and China in History (SOL3.2) and multiplication in Math (SOL3.4), so today students in Ms. Pumphrey’s class created multiplication problems about the inventions and contributions of these great civilizations. We began with a blank Google slideshow and chose a theme. Then they decided if they wanted to solve a problem about China or Egypt and included that in the title slide. On the next slide, we started building our multiplication problem. One concept that is often difficult for third graders to understand is that multiplication is really just multiple groups that are equal. To help them grasp this idea, I instructed them to make one group of objects from Egypt or China with a story explaining the grouping. For example, one family has three kites, or one piece of paper is made from seven papyrus plants, or one silk cloth is produced by ten silkworms. They typed a sentence and illustrated the group. Some students used a Google image search to find pictures, while others drew their own pictures using Kleki. On the next slide, the students made multiple groups by copying and pasting the one group. Then they asked the multiplication question, like, “How many kites do four families have?” or “How many silkworms would make five cloths?” On the final slide, students recorded the answer (you may want to leave the answer off, and let classmates solve each others’ problems). They shared their slideshows on Schoology, but you can see them all here.


3rd Grade Patterns and In-Out Boxes

Third graders at Varina Elementary have been learning how to identify, create, and extend patterns in Math (SOL3.16), so today students in Ms. Lanham’s class created patterns with Google Sheets. First, I gave the students a template to use that has fewer cells and a larger font size than Google’s default spreadsheet. Since this was the first time many of them had seen a spreadsheet, I explained that each row in a spreadsheet has a number, each column has a letter, and each cell is labeled with a combination of both (like A2 or C4). This is important to understand when it comes to writing formulas later. The top row usually has the column names, so I showed them how to highlight the row by clicking the number 1 on the left, and we made it all bold by clicking the Bold button in the toolbar. Then we typed the column names: In, Out, and Pattern. In-Out boxes are a great way to get students thinking about patterns because they focus on just two numbers (the number that goes “In” the box and the number that comes “Out”) and infer what happens inside the “Box.” The students typed a few random numbers in the first column. In the second column, they wrote simple formulas such as =A2+5 or =A3-3, and when they pressed “Enter,” they saw what came out of the “Box” they created. Some people may think spreadsheets are boring, but students get very excited when they see their formulas work. They especially enjoy this next trick to continue the pattern: click on a cell in the second column (one with a formula) and a blue box should appear; click and drag the bottom corner of the blue box across the rest of the row, and it automatically fills with the continued pattern! Finally, I showed the students how they could click the “Explore” button in the bottom right corner of the spreadsheet and choose their Formatting colors (or they could highlight rows and columns and make them whatever colors they wanted). We shared our spreadsheets on Schoology so their classmates could guess the patterns by typing a reply like, “Row 3 is +5.” You can see their spreadsheets here.


5th Grade Oceans Websites

Fifth graders at Trevvett Elementary have been studying the characteristics of ocean environments (SOL5.6), so today, students in Ms. Poland’s class created their own oceans websites using Google sites. First, the students accessed their Google Drive and clicked New > More > Google Sites. This opened up a starter template. They typed a creative title (with capitals), selected a background header image, and a theme. Next the students chose a layout and began typing the information they wanted to share. Some wrote about ocean life, others wrote about the ocean zones, and a few wrote about ocean topics that weren’t necessarily taught in class, but were interests of theirs. I usually guide students to write before searching for images, because the image search can become distracting and time consuming. However, I also understand that images can inspire further writing. So once the students had some focused typing time (ten minutes or so), I let them search for photos, even if they weren’t finished writing. After they added their photos, they went back and revised their writing until it was polished and complete. Finally, I showed them how to publish their webpages, copy the links, and share them on Schoology for their classmates to see. You can take a look at some of their work here (UPDATE: I taught this lesson in a few other classes and added their examples to the document).


3rd Grade Habitat Word Problems

Third graders at Trevvett Elementary have been solving addition and subtraction word problems in Math (SOL3.3b) and studying habitats in Science (SOL3.6ab), so today students in Ms. L’Heureux’s class created their own habitat word problems with Google Drawings. First we reviewed several different habitats and the animals that live in them (desert, grasslands, rainforest, arctic, etc). Next we thought about what kind of number problems could happen in their ecosystem and whether they involved addition or subtraction: animals could have babies, animals could die, animals could migrate, etc. The students came up with some creative ideas! Then we went to Google Drive and opened Google Drawings (New > More > Google Drawings). We created a background by clicking the Shapes tool, selecting a square, and using the Paint Bucket tool to give it a solid or gradient fill color. To add the title, we clicked Insert > Word Art, typed the title, pressed Enter, and changed the font, fill and outline colors. Then the students used the built-in Google image search to find a picture of an animal in its habitat. Finally, they added a speech bubble from Shapes and typed their addition or subtraction word problem inside it. We shared the links to our drawings in Schoology so our classmates could solve them in the comments. You can try to solve some of them for yourself here. (UPDATE: I adapted this lesson using Google Slides instead of Google Drawings for other classes because we wanted to make the answer appear at the end. I added some of those examples to the document).


3rd Grade Animal Research

Third graders at Trevvett Elementary have been learning about animal adaptations in Science (SOL3.4) and place value for six-digit numbers in Math (SOL3.1a). Today students in Ms. Hufnell’s class used their research skills to find images and facts about an animal of their choice, including how many exist. This gave us the opportunity to review and read large numbers up to six digits. First, we made copies of a Google drawing template (you can make your own copy here). Then, students clicked the Image button and did a Google image search for their animal. When we added the picture, we noticed that it covered the speech bubble, so I showed them how to click Arrange > Order > Send to back. Next, they clicked the Image button and chose “Webcam.” Each student took a photo of their own face to put in place of the animal’s face. To make it more realistic-looking, we used the cropping tool to make the face into a circle shape. Students typed complete sentences in the speech bubble explaining their animal’s adaptations. Finally, they asked Google: “How many (of my animal) are there?” and they wrote the number in the scroll shape. They could change the color of the speech bubble and scroll with the paint bucket tool when they finished. We shared our projects with each other on Schoology, but you can see them all here.


Graphing with Google Drawings

Third graders at Varina Elementary have been learning how to collect data and create graphs (SOL3.15), so today students in Ms. Long’s class made graphs with Google drawing. Usually we use Google sheets to create graphs, but Google drawings are another great option. There are two features that I really like about graphing with Google drawings: You can easily change the color of each bar (in sheets, the default is one color for all bars), and you can resize the bars by clicking and dragging, which provides practice for the technology enhanced items (TEI) on our tests. First, we collected data by asking the students to answer a few polls within Schoology. You could also let the students create their own polls with Google forms, but I wanted to show the teachers this built-in feature of Schoology. The polls were on a variety of topics: favorite sports, foods, and colors. After the students voted, they opened a template (you can make a copy here) and chose the data they wanted to graph. Next, they edited the text boxes so the title and categories matched their data. I showed them how to click and drag the bars to the correct lines and change their colors with the paint bucket. Finally, we shared our graphs in Schoology and analyzed the data. We asked questions, like, “What is the most popular food?” or “How many more people like basketball than football?” The students noticed that graphs make it a lot easier to understand their data. You can see some of their graphs here.


Tags:


3rd Grade Animated Food Chain Relationships

Third graders at Holladay have been learning about the relationships among organisms in aquatic and terrestrial food chains (SOL3.5), so today, students in Ms. Haley’s class created animations with Loopy to illustrate some of those relationships. First, we reviewed the different ecosystems: forest, desert, arctic, freshwater, ocean, etc. Then, students chose one ecosystem and typed the name of it in Loopy using the Text tool. Next, they used the pencil tool to draw a circle to represent a plant. If students didn’t know a plant that lived in their ecosystem, I showed them how to ask Google using the microphone. Next, students added an animal that eats that plant. Again, they could use Google for research. A great feature of Loopy is that it can show positive or negative relationships with arrows. We drew an arrow from the plant to the animal and discussed whether it should be positive or negative. It’s positive because more plants would mean more animals since they have a bigger food source. Then, we drew another arrow from the animal to the plant and made it negative (click the box in the upper right corner). It’s negative because more animals would mean less plants since they eat them. Students could continue adding animals to their web and using arrows to show the relationships between them. Finally, we pressed play and explored what happens when we change the population of each organism (by pressing the up or down arrows). We saved our animations as weblinks and shortened them with bitly. You can see them all here.


3rd Grade Coding Money and Change

Third graders at Laburnum Elementary have been learning about money and counting change up to five dollars (SOL3.8). Today students in Ms. Hunt’s class used a new coding program called Wick to create an interactive math problem about making change. First, I showed them a couple of examples so they could get an idea of what we were going to do (here and here). I pointed out that their projects could look very different, but they had to have three things: (1) an object to buy with a price under $5; (2) a person with a $5 bill; (3) a right and a wrong answer. To get the students started, I created a template with some money files that you can download here. The students downloaded my template from Schoology, started a new project in Wick, and uploaded the template (File > Open). Now, in the Assets Library on the right, they had some money images to use if they wanted. They illustrated their problem with the drawing tools and typed out the question and answers with the text tool. We created two more frames by copying the first one (right click > Clone frame) and made a few changes to show the correct answer (the person gets the object and is happy) and the incorrect answer (the object leaves and the person is sad). Finally, we added the code to the buttons so that they go to the correct frame. One of the things I really like about Wick is that is uses real code. So we added a stop() code to each frame and programmed the buttons to go to the correct frames gotoAndStop(2) or (3). Wick exports projects as HTML files so they play in any browser. You can see all their projects here.


Tags:


3rd Grade Mali Perimeter & Area

Third graders at Trevvett Elementary have been learning about perimeter and area in Math (SOL3.10), and they have been studying the ancient civilization of Mali in History (SOL3.2). Today, students in Ms. Cockrum’s class found the perimeter and area of the famous Malian city, Timbuktu. First, we found Timbuktu on Google maps and used the scale to estimate its perimeter and area. To record our data, we made a copy of this spreadsheet that I had prepared ahead of time with the correct font sizes and cells. I demonstrated how to make some practice shapes by clicking and dragging through the cells and using the paint bucket to change the fill color. Then we used the squares to calculate the perimeter and area of our shapes and entered the values into the corresponding cells. Now the students were ready to measure Timbuktu, Mali. We made a copy of this Google drawing to make the process a little easier. The students could click and drag the square miles around the perimeter (turning the squares by dragging the blue circle that appears over each one when it’s clicked), and they could drag the squares inside of the city to find the area. The squares are transparent so the students could see what is underneath. Once they found the perimeter and area of Timbuktu with the squares, they entered the values into their spreadsheet. Finally, we clicked the Share button on our spreadsheets and pasted the links into Schoology. You can take a look at them all here.