
Graphing with Google Drawings
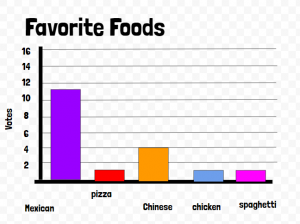 Third graders at Varina Elementary have been learning how to collect data and create graphs (SOL3.15), so today students in Ms. Long’s class made graphs with Google drawing. Usually we use Google sheets to create graphs, but Google drawings are another great option. There are two features that I really like about graphing with Google drawings: You can easily change the color of each bar (in sheets, the default is one color for all bars), and you can resize the bars by clicking and dragging, which provides practice for the technology enhanced items (TEI) on our tests. First, we collected data by asking the students to answer a few polls within Schoology. You could also let the students create their own polls with Google forms, but I wanted to show the teachers this built-in feature of Schoology. The polls were on a variety of topics: favorite sports, foods, and colors. After the students voted, they opened a template (you can make a copy here) and chose the data they wanted to graph. Next, they edited the text boxes so the title and categories matched their data. I showed them how to click and drag the bars to the correct lines and change their colors with the paint bucket. Finally, we shared our graphs in Schoology and analyzed the data. We asked questions, like, “What is the most popular food?” or “How many more people like basketball than football?” The students noticed that graphs make it a lot easier to understand their data. You can see some of their graphs here.