Category: 5th Grade

5th Grade Comparing Fractions & Decimals

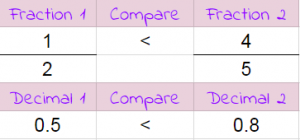
Fifth graders at Varina Elementary have been learning how to compare fractions and decimals (SOL5.2). Today students in Ms. Messer’s class learned how use a spreadsheet to convert fractions to decimals and compare them. First, we opened a blank Google spreadsheet and wrote the following column headers: Fraction 1, Compare, Fraction 2, (Blank), Decimal 1, Compare, Decimal 2. In order to make the two fraction columns look like fractions, I showed them how to click in the numerator cell, then use the cell format button (it looks like 4 squares in the toolbar) to add a line at the bottom. Then they entered a numerator and a denominator for the two fractions. To convert the fractions into decimals, the students needed to write a formula. I explained that the formula would use cell addresses (like A2 or C3) instead of particular numbers so that we could change the numbers and the formula would still work. This is a great way to help students understand the concept of a variable (SOL5.18). They helped me develop the formula =A2/A3 for the first fraction, and I expected them to figure out the formula for the second fraction =C2/C3. The formula for comparing them is a bit more complicated, but they were able to figure it out with guidance:

=IF (E2 > G2, “>”, IF (E2 < G2,"<","="))

Basically it says if the left decimal is greater than the right decimal, show the greater than symbol; if it’s less, show the less than symbol; otherwise show equals. Finally, we added a simple formula to compare the fractions by just copying the same symbol from that cell =F2. The students were excited to see their formulas work, even when they changed the fractions. You can see all their examples here.


3rd Grade Measurement Movies

Third graders at Laburnum have been learning about liquid measurement in Math (SOL3.9b), so today students in Ms. Hunt’s and Ms. Gradeles’ classes created measurement movies with WeVideo. Students could choose whether to work alone or with a partner. We reviewed the units of liquid measurement they have been learning about: cup, pint, quart, gallon, and liter. They chose one unit and used books, notes, and the Internet to find examples of liquids that would be measured by their unit. I showed them how to download images from a Google image search by right clicking on them and choosing “Save image as…” Then we went to WeVideo and signed in with our Google accounts. WeVideo starts out in Timeline mode, which is a little complicated, so we switched to Storyboard Mode (click on the 3 lines in the top left corner). This reveals a Title screen at the bottom. I instructed the students to click the pencil icon on the Title screen to change the title to their unit of measurement. Then students pressed the red record button, and (after installing the necessary webcam extension) recorded themselves introducing their topic. I showed them how to upload the images they had saved earlier by clicking the green cloud icon. Students added the images to their video by clicking and dragging them down in the order they wanted them to appear. Finally the students selected a Theme with music by clicking the magic wand button. We found that we needed to switch back to Timeline mode to lower the volume of the music so we could hear our voices. Once our movies were complete, we clicked the Finish button and copied the link into Schoology. Now students can watch each other’s videos for a fun review of the units of liquid measurement! You can see them all here.


Tags:


5th Grade Fact Opinion Posters

Fifth graders at Trevvett Elementary have been learning how to distinguish between facts and opinions (SOL5.6i), and they have been writing with adjectives and adverbs in English (SOL5.8b). Today, students in Ms. Golden’s class used PicMonkey to create winter posters that included facts, opinions, adjectives, and adverbs. First we reviewed clues for differentiating facts and opinions. Facts are undeniable truths that can be proven with evidence. They are true for everyone, even if they don’t believe it. For example, “He is driving quickly over the speed limit” is a fact. It can be proven with measuring devices (even if the driver doesn’t believe it). Opinions are usually based on feelings, and they can be different for different people. For example, “He is a bad driver” is an opinion. You do not have to agree with it. Next, we identified the adjectives and adverbs in the sample sentences (and other sentences the students came up with). I explained that they would be creating winter posters with two sentences about winter. One needed to be a fact and the other needed to be an opinion. Their classmates would try to differentiate them. They also needed to include an adjective and/or adverb in each sentence. To make the posters, we went to PicMonkey and clicked “Edit a photo.” This allows you to edit a photo without logging into an account. The students took photos of themselves with their webcams and uploaded them. Then they used the special Winter effects to decorate their pictures with frost, snow, rosy cheeks, and clip art. I showed them how to use the text tool to write their sentences and how to change the color of the adjective or adverb. They saved their photos and uploaded them to a discussion in Schoology with a question for their classmates to answer (What is the opinion? What is the fact? What is the adverb? What is the adjective?). You can see them all here.


5th Grade Coding an Ocean Tour

Fifth graders at Trevvett Elementary have been learning about the ocean (SOL5.6), so today students in Ms. Adamonis’ class used code to create an ocean tour in Scratch. First, we discussed different topics they could include in their tour: parts of the ocean floor, different depth zones, and various ecosystems. Next, we went to Scratch, and I showed them how to change the background by either drawing it or uploading a picture. Then they needed to add a tour guide (called a “sprite” in Scratch). Most of the students chose one from the built-in library, but they could also draw their own. Finally, I explained how to use code to create the tour. The drag and drop pieces of code could be used to animate the tour guide and make it “speak.” They quickly discovered the sound effects code and had fun adding audio to their projects. Some of the students went way beyond the original scope of the assignment and added keyboard strokes so that it could be played by an external controller (like a Makey Makey). They shared their finished projects on Schoology, but you can see them all here.


Tags:


5th Grade Weather Tools

Fifth graders at Trevvett Elementary have been reviewing 4th grade weather tools (SOL4.6b), so today students in Ms. Capano’s class created animated GIFs showing the weather tools in action. We used ABCYa! Animate to create the moving images. First we brainstormed creative ways to illustrate each tool (rain gauges filling up, anemometers rotating, thermometers rising or falling, barometer dials moving, wind vanes spinning). Next, we went to ABCYa! Animate and drew a picture of the instrument as well as the background weather. I showed them how to copy each frame with the Copy Cat button. Then they added small changes and moved objects by increments in each subsequent frame. I pointed out that they could use the Text Tool to add neat numbers to their instrument for accurate measurements. Finally, we exported the animations as GIF files and posted them to an album in Schoology, but you can see them all here.


5th Grade Plate Boundary Animations

Fifth graders at Holladay Elementary have been studying the Earth’s crust and plate boundaries (SOL5.7e), so today students in Ms. Haislip’s class created animations illustrating some of the different boundaries. First, we reviewed divergent boundaries, convergent boundaries, and transform boundaries with a few sample animations as examples: Animation 1, Animation 2, and Animation 3. Next, students created their animations using ABCYa! Animate. We worked on the divergent boundary together to help them understand the process, then they illustrated the other boundaries on their own. We discussed ways to show the various plate motions and their effects, and I encouraged them to look back at the examples for ideas. The students published their finished animations on Schoology, but you can see them all here.


5th Grade Ocean Ecosystems

Fifth graders at Trevvett Elementary have been learning about the ocean zones and ecosystems (SOL5.6). Today students in Ms. Reed’s class created animations illustrating an ocean food chain. First, we did a bit of research. I asked the students to think of an ocean creature they wanted to include in their food chain, then they had to research what it eats and what eats it. I pointed out that all food chains start with the sun’s energy, so they had to follow their food chain back to the beginning. For example, I modeled the process with a jellyfish. I did a Google searches for “What does a jellyfish eat?” and “What eats a jellyfish?” I discovered that jellyfish eat small plants (phytoplankton) and their predators include tuna. From there, I found out that phytoplankton get their energy from the sun and tuna get eaten by sharks. Once our research was finished, we were ready to illustrate the ocean food chain. We used ABCYa! Animate to create the animations. We showed the suns’s rays causing a plant to grow, then added different animals to move in and eat the previous living thing. We posted their animations to an album in Schoology, but you can see them all here.


5th Grade Multiple Meaning Words

Fifth graders at Trevvett Elementary have been learning about words with multiple meanings and homophones (SOL5.4). Today students in Ms. Brown’s class created a Google slideshow to illustrate two different meanings of a word or a pair of homophones using context clues. First we utilized the Schoology discussion feature to brainstorm multiple-meaning words. You can see a short sample of the discussion by clicking on the photo accompanying this post. Notice the student names and photos are blurred out. You can do that using a cool site called FacePixelizer. Next the students opened a blank Google slideshow (the quickest way is to give them a direct link to their Google slides). I showed them how to search for an background image that isn’t too distracting by clicking the Background button > Image > Choose > Search. Some good search terms to use are “texture” or “bokeh” (blurred lights). Then we changed the title to “Multiple Meaning Words” and added their name to the subtitle. I also demonstrated how they could change the font, size, and color of the words. On the next slide we typed a sentence using both meanings of the word or homophone, and we underlined them. I explained how to add transitions and animations to the slide as well. Finally, I showed them how to add an image illustrating the sentence. We shared our slideshows with each other on Schoology. You can see them all here. (UPDATE: I taught a similar lesson with Ms. Hall’s class at Holladay on 10/10, but we did it a little differently. I have added them to that page).


5th Grade Virtual Tours of U.S. Regions

Fifth graders at Holladay Elementary have been learning about the different regions of the United States, so today students in Ms. Sharpe’s class created virtual tours of the U.S. regions using CoSpaces. First, the students selected a region from the five possible choices: northeast, southeast, midwest, southwest, and west. Next, they used their notes and the Internet to research important facts about their region. I also instructed them to find and download a 360 degree photo of an interesting place in their region (search place name + 360 – NOTE: a 360 degree photo will appear somewhat curved). Then we were ready to start creating our virtual tour. We signed into CoSpaces with our Google accounts and created a new project. We clicked the Environment button at the bottom to upload our 360 degree background photo. I showed them how to add 3-D people and objects using the Library. In order to customize the objects’ positions, poses, sizes, and colors, we right clicked on them and selected the appropriate buttons from the pop-up menu. The students added speech bubbles to explain important facts about their regions. We tested our VR scene by clicking the play button (you can move around the scene by clicking and dragging or using the arrow keys). If students weren’t satisfied with where the camera view started out, I showed them how to adjust that with the “Special” button in the Library. Finally we clicked the “Share” button at the top and copied our links into Google classroom so we could view each other’s tours. You can see them all here.


Tags:


5th Grade Review with Chatbots

Fifth graders at Holladay Elementary have been reviewing for exams, so today students in Ms. Neal’s class created review questions for each other in the form of a chatbot. A chatbot is an online virtual assistant that you’ve probably already had interactions with if you’ve used the chat feature on a business website. The chatbot is programmed to ask you questions and give replies based on your answers. We used a website called Fobi.io which turns any Google form into a cool-looking chatbot. First we created the Google Form by going to our Google drive and choosing New > More > Google Forms. I explained that the first question should be: “What is your name?” Then the students had to come up with two multiple choice educational questions about any topic they’ve learned about this year in 5th grade (we brainstormed a list of topics, in case they had trouble remembering). They could also create additional questions of their own if they had time. We published our forms by clicking the “Send” button and copied the link. Next we went to Fobi.io and pasted the link to our form. Now we could program the chatbot Fobio to reply to each of the questions. For example, if an answer was correct, he could say, “Great job!” or if it was wrong, he could say, “Try again!” The students were very creative in their responses. You can take a look at some of their chatbots here.