Tag: webtools

3rd Grade 3-D Animal Reports
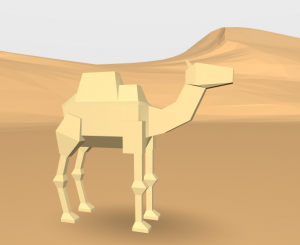
Third graders at Holladay Elementary have been studying animals and their habitats in Science (SOL3.4, 3.5, 3.6). They have also been learning about how to write research reports in Language Arts (SOL3.11). Today students in Ms. Ambrose’s class researched an animal of their choice with PebbleGo and created a 3-D report using CoSpaces. First, students selected an animal and used PebbleGo to find out about its habitat and its design, or adaptations. We discussed whether PebbleGo is a reliable website (it is :). Next, we logged into CoSpaces with our Google accounts, and I showed them how to choose a background image that looked like the animal’s habitat. Then we searched for a 3-D model of our animal (or an animal that looked similar). I explained that they can change the color of their animal by right clicking on it. They also needed to use the right-click to make the model accessible in Blockly (the coding language). We wanted to code the animal to speak about itself and share the facts we learned, but before we could do that, we had to record ourselves. We used Vocaroo to record and save an MP3 file (you could also use Audacity). We uploaded the file to CoSpaces using the Upload button. Finally, in Blockly, we added a few bits of code to make the animal speak when you click on it. Some of the students even added code to make the animal move. We published our projects and shared the links on Schoology. You can see them all here.



4th Grade Virginia Tally Marks & Graphs

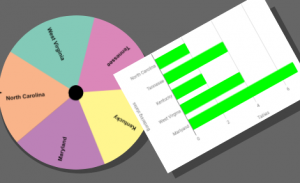
Fourth graders at Varina Elementary have been learning about Virginia geography (VS.2) and Jamestown (VS.3) in Social Studies, and they have been making bar graphs in Math (SOL4.14). Today students in Ms. Belcher’s class chose a Virginia topic, created a spinner out of its subtopics, tallied the spins, and graphed the results. First, we reviewed various topics they could use to generate their spinner subtopics: Virginia Rivers, Virginia Regions, Indian Language Groups, Problems at Jamestown, Bordering States, etc. Next, we created our custom spinners using a cool webtool called WheelDecide. Then they spun the spinner as many times as they could in two minutes and tallied the results on paper. To make the graph, we used a Google spreadsheet. I showed them how to access their Google shortcuts (the array of 9 tiny squares in the top right corner of a Google search page), and we opened a new spreadsheet. In the first column we typed the spinner subtopics, and in the second column we typed the number of tallies for each one. Then we highlighted the columns, pressed the graph button, and a bar graph appeared! I showed the students how to change the colors of the bars, if they wanted. We shared our spreadsheets on Schoology, but you can see them all here. Can you guess the main topics just by looking at the graphs?


3rd Grade Multiplication Arrays

Third graders at Laburnum Elementary have been learning about multiplication arrays (SOL3.6), so today students in Ms. Forrester’s class created videos explaining multiplication arrays with Educreations. First, we reviewed arrays and how to use them to solve a multiplication problem. I pointed out that they probably wouldn’t want to make a big array (like 12×12) because they will need room on their picture to explain each step. Next, we went to ABCYa! Paint to create the array since it has some cool stickers (robots, monsters, cupcakes, etc) they can use. I reviewed the importance of aligning the groups neatly. When they finished, we imported the image into Educreations and recorded ourselves counting the groups and explaining how many were in each group. Finally, we wrote the multiplication problem and solved it. Each student posted the link to their video in Schoology, but you can see them all here. (I taught a similar lesson with Ms. Kazlau’s class at Trevvett where we used ABCYa! Animate. You can see those here).


4th Grade Powhatan Dioramas

Fourth graders at Varina Elementary have been learning about the Indian tribes of Virginia and their language groups (VS.2d,e). Today students in Ms. Connell’s class created virtual 3-D dioramas of a tribe of their choice using CoSpaces. First, we reviewed the tribes (Powhatan, Monacan, and Cherokee), their language groups (Algonquian, Siouan, and Iroquoian), and where they lived in Virginia. Next, I explained the project and pointed out that these dioramas could be viewed and explored with virtual reality goggles. They could also use coding to add actions and sounds to their project (we didn’t get that far, but I made an example here where you can click each person, and they will move and speak). After logging into CoSpaces with our Google accounts, we created a new space, and I showed them how to set the background with the Environment button at the bottom. CoSpaces offers a few backgrounds, but we did a Google search for a 360 degree photo of Virgina woodlands, and uploaded that. Next I showed them how to add characters from the Library and right click on each one to customize its colors and poses. I also explained how to add speech bubbles and type facts about the tribe. We used the Building Blocks library to create model longhouses. Finally we clicked the share button, copied the link, and posted our creations on Schoology. You can see them all here.


3rd Grade Animal Habitats Graph

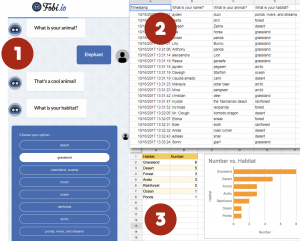
We’re on an animal habitats streak here! In previous posts I’ve shown how your habitats unit (SOL3.4) can reinforce the skills you are teaching in Social Studies and Reading. Now we’ll see how it can reinforce Math concepts as well. At Trevvett Elementary, third graders have been learning about graphing (3.17), so today students in Ms. Bae’s class practiced graphing animal’s habitats. First we had to collect some data. I used Fobio to convert a Google form into a chatbot to make the process a bit more interesting. You can try the chatbot out for yourself by clicking here. Once the students had entered their information, I took a screenshot of the results spreadsheet and posted it to Schoology (step 2 in the graphic accompanying this post). Next the students opened a blank Google spreadsheet and typed the habitats in Column A and the number of animals in Column B. I showed them how to use the new “Explore” feature by clicking the star shape in the bottom right corner. From the pop-up window they could change the colors of the rows and automatically add a bar graph (step 3 in the graphic). I explained that they could also change the colors of the bars by double clicking on one of them, then clicking the paint bucket in the pop-up window. The students shared the links to their spreadsheets on Schoology. You can see an example here. (UPDATE: The next day at Holladay, Ms. Haley’s class combined Math & Science by writing math word problems about animals. See them here).


3rd Grade Animal Nonfiction Books

Third graders at Varina Elementary have been learning about animals in Science and nonfiction text elements in Reading (SOL3.6c). Today students in Ms. Hummel’s class used Book Creator to design a nonfiction book about an animal. First the students chose an animal and did some quick research online to find interesting facts about their animal. Then they signed into Book Creator with the teacher’s class code (to get the code, teachers should click on their class library from the drop down menu and click “Invite”). Students chose “New Book” and clicked the i button to choose a color for their book. They added a title by clicking the + button and selecting “Text.” I demonstrated how to customize the text’s font, size, and color using the i button. Next, they added a photo of their animal using the built-in image search by clicking the + button and “Import.” We flipped to the next page and started typing facts. Since we wanted to include nonfiction text features like bold text, captions, and photos, I showed them how to make important words bold by highlighting them and clicking the “B.” Finally we created an “About the Author” page. Book Creator has a special feature that let’s students take photos and videos right within the app, so they added photos or videos of themselves. I combined all the books together in one book (click the “books” button, then “Combine books”). You can read it here (I did similar book projects today with 5th Grade Oceans and 4th Grade Weather).


2nd Grade Ordinal Numbers

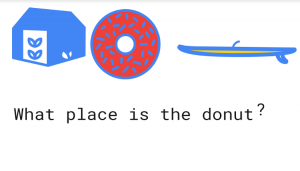
Second graders at Trevvett Elementary have been learning about ordinal numbers (SOL2.2), so today students in Ms. Smith’s class created ordinal number questions for their classmates to solve. First, we used to Google’s Autodraw to draw a series of objects. AutoDraw can guess what you are drawing and offer suggestions. For example, if you draw a rough circle, it will provide a perfect circle to replace it with, or it may suggest an orange, a ball, or a wheel. So it’s a great way for students to practice their drawing skills without worrying about being perfect. I explained that their series of objects needed to be in one straight line so their classmates could tell the ordinal positions correctly. Then we used the text tool to type a question. They could either give the position of an object and ask for its identity (“What is in the 3rd place?“) or they could name the object and ask for its position (“In what place is the apple?”). When they finished, the students downloaded their images and shared them in an album on Schoology. Now they can answer each other’s questions in the comments or Ms. Smith can present them on the projector for a review. You can see them all here (and here’s a link to Mr. Gunter’s class at Holladay, who did the same project).


New Teacher Academy

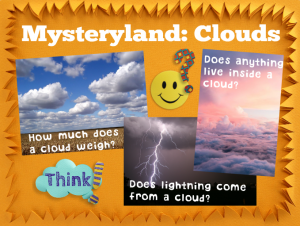
Today was New Teacher Academy, our county’s training session for newly hired teachers. My team’s job was to share ideas for using technology in the classroom. Alfonso and I presented a session called “Mysteryland” with the 4th grade teachers. Mysteryland is a music festival that I attended one summer, but it could also be your classroom, because classrooms are places for exploring mysteries. When you present topics as mysteries to solve, it stimulates students’ natural curiosity and increases motivation to learn. We used clouds (SOL4.6) as an example to show that every topic has plenty of mysteries to investigate: How much does a cloud weigh? Why does a cloud form in one spot and not another? Does anything live inside a cloud? Does lighting come down from clouds or up from the ground? Do clouds protect us from anything? Does wind speed and direction have anything to do with cloud cover? (Look here or here and turn on cloud cover)? Technology can be used by teachers to present these mysteries to the students in creative ways, but once a few mysteries have been presented, technology can be used by students to share their own questions with each other, research the answers collaboratively, and publish their findings online. We shared a variety of webtools for accomplishing these tasks. For example, we asked each new teacher to research a cloud mystery and post their answers on a shared Google spreadsheet. Try adding an element of mystery to your lessons this year!


5th Grade Review with Chatbots

Fifth graders at Holladay Elementary have been reviewing for exams, so today students in Ms. Neal’s class created review questions for each other in the form of a chatbot. A chatbot is an online virtual assistant that you’ve probably already had interactions with if you’ve used the chat feature on a business website. The chatbot is programmed to ask you questions and give replies based on your answers. We used a website called Fobi.io which turns any Google form into a cool-looking chatbot. First we created the Google Form by going to our Google drive and choosing New > More > Google Forms. I explained that the first question should be: “What is your name?” Then the students had to come up with two multiple choice educational questions about any topic they’ve learned about this year in 5th grade (we brainstormed a list of topics, in case they had trouble remembering). They could also create additional questions of their own if they had time. We published our forms by clicking the “Send” button and copied the link. Next we went to Fobi.io and pasted the link to our form. Now we could program the chatbot Fobio to reply to each of the questions. For example, if an answer was correct, he could say, “Great job!” or if it was wrong, he could say, “Try again!” The students were very creative in their responses. You can take a look at some of their chatbots here.


3rd Grade Shapes in Virtual Reality

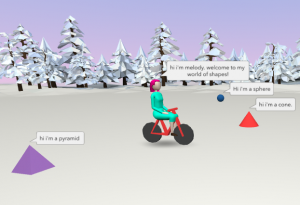
Third graders at Trevvett Elementary have been learning about plane and solid geometric figures (SOL3.14). Today, students in Ms. Hufnell’s class used our new resource, CoSpaces, to create a virtual reality world of 3-D shapes to explore. First, we logged into CoSpaces with our Google accounts, then we created a new space. I showed them how to click the Environment button in the bottom left corner to choose a background image (you can also upload 360 degreee photos). Next, we went to the image library and added a person. The students could customize the people by right clicking on them and changing their colors and poses. We added a speech bubble, and typed an introduction. Then we went back to the library and added a variety of solid figures. Using the right click, we changed the colors of the shapes and typed sentences describing them in speech bubbles. You can even use coding to program the shapes to be interactive. We didn’t have time to do that today, but here’s an example. Finally, we clicked the share button, copied the link, and pasted it into Schoology so we could explore each others’ virtual worlds. You can explore them yourself here.