Tag: GoogleMaps

3rd Grade Parthenon Perimeter

Screen Shot 2015-05-12 at 8.02.58 AM
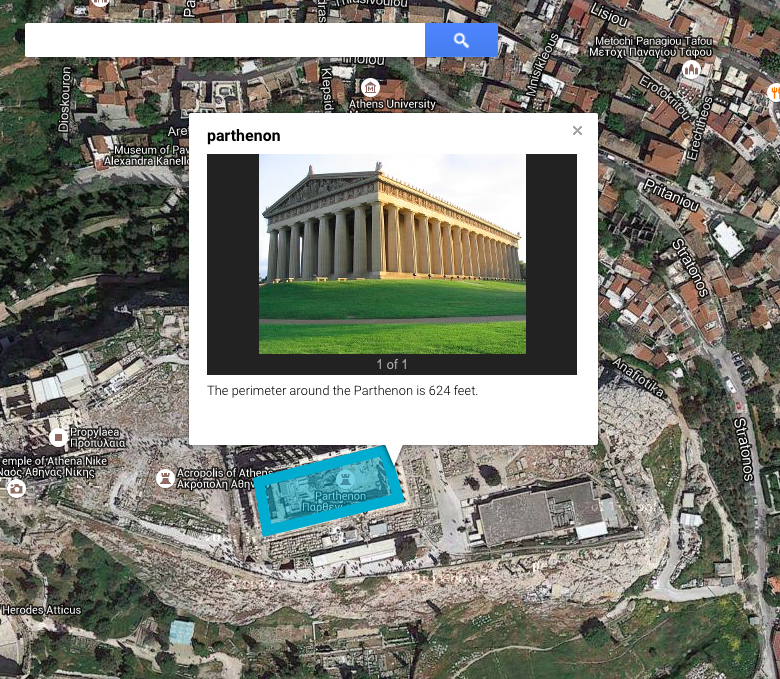
Third graders at Davis Elementary have been learning about the architecture of the ancient Greeks (SOL3.1) and how to identify Greece on a map (SOL3.4). They have also been studying perimeter in math (SOL3.9d). So today students in Ms. Eller’s class found the Parthenon using Google maps and calculated the perimeter of it. First we signed into our Google accounts and went to Google classroom where I posted a link to My Google Maps. The students clicked “Create a Map,” and we talked about where Greece was located. First we found Europe, then we located the Mediterranean Sea. Since the map was labeled, it was easy to find Greece. We zoomed in on Greece, and I instructed them to keep zooming in on the labeled city of Athens. Once they were closer to the city, we started zooming in on a green patch labeled “Acropolis.” Then we switched over to Satellite view (click Base Map in the left menu box). Now we could actually see the Parthenon and its columns! By the way, if you would like to give your class a virtual tour of the Parthenon you could go to it in regular Google maps and drag the yellow peg man from the bottom right tool bar to one of the blue dots that appear near the Parthenon for a Street View panoramic tour of the site! To calculate the perimeter of the Parthenon you could use the ruler tool and measure all the sides, but we used the line tool and drew a rectangle around the Parthenon. I showed them how to change the color and thickness of the shape using the paint bucket that appears next to the shape in the left-hand key. When you click the shape after you’ve saved it, a box pops up that gives you the perimeter. We clicked the pencil on the box to edit it and wrote the perimeter in the description (other people who view the map won’t see the perimeter unless it’s in the description). We also clicked the camera tool to add a photo of the Parthenon. We posted the links to our maps in Google classroom so we could compare our measurements with our classmates’. You can look at some of their maps here.


5th Grade Elapsed Time Maps

Screen Shot 2015-05-01 at 8.37.18 AMFifth graders at Laburnum Elementary have been learning how to find elapsed time in math (SOL5.10), and they’ve been studying the southeast region of the United States in social studies (SE1.2). So today students in Ms. Conway’s class created elapsed time word problems using Google maps. First they signed into their Google accounts and I posted a link to My Google Maps on the classroom page. They clicked “Create a new map” and placed a marker on a city in the southeast region that they are interested in visiting. They labeled their marker and added a photo of the city by clicking the camera icon and doing a Google image search. Next they clicked the directions icon (it looks like a curved arrow), and calculated the time and distance from Richmond to their city. Finally they clicked the pencil icon on their marker label and typed an elapsed time word problem in the description box. We shared our maps by clicking the Share button and making it viewable by anyone with the link. Then we posted our links to the Google classroom page for our classmates to solve. See how many you can solve by taking a look at them here.


3rd Grade Descriptive Habitat Maps

Screen Shot 2015-04-29 at 2.55.26 PMThird graders at Varina Elementary have been learning about habitats and ecosystems in science (SOL3.6) and writing good descriptive details in Language Arts (SOL3.9), so today we created descriptive habitat maps in Ms. Wells’ and Ms. Leo’s classes. First we practiced writing descriptive sentences about our weekend, posting our ideas to the Google classroom page. Then I posted a link to My Google Maps and the students clicked the “Create a New Map” button (they were already logged into their Google accounts). We switched the Base Map to Satellite view so we could see the landscape. We discussed how the different colors on the map indicated the habitat–brown for deserts, green for forests, blue for water, and white for ice and snow. Next I showed them how to create markers for the different habitats and instructed them to write a good descriptive sentence about each habitat on the marker. I also showed them how to add a photo by clicking the camera icon. We tried to find pictures with animals that lived in the ecosystems. Finally I taught them how to change the look of their markers to reflect the habitat, like using a sun icon for the desert and a tree icon for the forest. We posted our maps to Google classroom, and I collected both classes’ maps together for you to view here.


3rd Grade Explorers Maps

Screen shot 2014-03-31 at 10.29.48 AMThird graders in Ms. Remley’s class at Davis Elementary have been learning about the Explorers (SOL3.3). Today I showed them how to make their own interactive maps using Google Maps Engine. First I let them choose which explorer they wanted to research: Columbus, Cartier, Newport, or Ponce de Leon. Next they placed a marker on the country that sponsored their trip. I showed them how they could change the color of the marker or even the icon itself. We also created a pop-up label for the marker. The students wrote the name of the country and a sentence about the reasons for the voyage, then they added a picture to represent that country. They placed another marker on the final destination and added a similar pop-up label to it. They also drew a line to show the route the explorer took. I showed them how to change the color and size of the line. Finally they customized the look of their map and published it. I posted all their links to a Google Doc that you can take a look at here. UPDATE 3/24/16: I taught a very similar lesson in Ms. Marion’s class at Holladay, but this time we also rounded the length of the journey since they were learning how to round to the thousands place (SOL3.1b). You can see those here.


1st Grade U.S. Symbols Research

symbolsFirst graders in Ms. Long’s class at Davis Elementary are doing research projects on the U.S. Symbols (SOL1.11). One great place to do research is PebbleGo because they have pages about all the U.S. Symbols, but did you know you can make your own webpage for research like PebbleGo? The advantage to making your own is you can include everything you want and customize it for your class. I wanted the students to be able to see on a map where some of these symbols are located and be able to zoom down and actually view them. So I created a webpage about each symbol using CheckThis. With CheckThis, making a website is as easy as typing a few sentences, uploading some pictures, and adding links to whatever media you want to include. I embedded some Google Maps for the interactive zooming feature (the students were surprised to see that the Statue of Liberty is on an island in the water). With Google Maps you can click the Satellite view and actually see the real place, which the students enjoyed doing. I also added a Soundcloud recording of myself reading the webpage for students who needed help. You can record your own voice right in Soundcloud then link to it in Checkthis. Finally I added a poll so anyone who visits the website can vote on their favorite U.S. symbol. The students were able to complete their research in just an hour, and hopefully everyone, including Ms. Long, learned something new! Here are the links to the individual sites: Bald Eagle, Washington Monument, Statue of Liberty, U.S. Flag. Or you can see where I put all the links on one page for the students here.


4th Grade Virginia Geography Maps

ButchFourth grade students in Ms. Cousins’ class at Davis Elementary created their own Virginia geography maps to show the different places and features they need to know (VS.2). They used Google Maps Engine Lite to place markers on and around Virginia identifying the five regions, the five bordering states, and the 4 major rivers. They also labeled the important cities for each river. Take a look at a student example here. They caught on quickly and enjoyed color coding their different place markers. Since it’s a Google Map it’s fully scrollable and zoomable so some students, like this one, even went further and identified their school and their country of origin. Students can go home and show their parents and study the information in a way that’s personally meaningful. I’m hoping this will be a tool, like Google Earth, that teachers use all year long in their geography lessons. Let me know if you’d like me to show your class how to do it.


5th Grade Henrico Math Websites

DivonneFifth grade students in Ms. Allen’s class at Laburnum Elementary have been learning about important places in Henrico County (HC.1). They have also been studying 2-digit multiplication in math. So today we combined the two topics into one lesson. First the students had to pick two famous places in Henrico County and use Google Maps to figure out the distance between them. Next we went to CheckThis and created a website with the embedded map and a word problem that involved multiplying the distance by a specific number. For example, a person might have to travel back and forth between the two places a certain number of times. Then the students created a poll question with various answers that visitors could choose. I posted all of their sites onto one page that you can see here. Students can answer each others’ questions to review multiplication as well as places in Henrico County.


4th Grade Virginia Indian Maps

Kimber AnthonyCreating Google maps with students is a great way to teach them about geography and history. Recently Google rolled out some changes that make the process simpler, and they call it Maps Engine Lite. So today I tried it out with the fourth graders in Ms. Anthony’s class at Holladay Elementary who have been studying the Indian tribes of Virginia (VS.2). They created maps showing where the tribes lived and added a description so that when people click on the regions they would be able to see which tribe lived there and what language they spoke. The maps are customizable in many ways. Students can choose different base maps such as satellite or terrain view. They can change the colors of shaded regions and pick different place markers. Each map gets its own link, so students are able to show their parents the maps they made and study at home (or anywhere). Take a look at two student examples: Kimber and Steven.


4th Grade Civil War Timelines

Picture 2Fourth graders at Chamberlayne Elementary are currently studying the Civil War. There are a lot of people, places, and battles they have to remember, and making a timeline helps keep everything in perspective. My supervisor, Tom Woodward, just told me about a cool webtool, TimelineJS, that can create a timeline from a Google spreadsheet. So I decided to try it out with the fourth graders today. First I set up a Google Spreadsheet for each class using the template found on the website. Then the students choose a partner to work with, and we generated a list of people, events, and battles from the Civil War. Each team selected one topic and conducted some very quick research. They also found a picture and made a Google Map to embed in the timeline. They were assigned rows on the spreadsheet corresponding to their student numbers (it doesn’t matter if the events are listed in order on the spreadsheet… the webtool sorts it all out). They entered the information into the correct columns and copied/pasted the link to the picture or map. It was a great example of crowdsourcing because in just a few minutes we had collected enough information to make a timeline about the Civil War without having to enter all the data individually. What’s really cool is, each student can use the same data to create their own customized timeline. All they need to do is copy the document link into the TimelineJS Embed Generator, choose the font and style they like, and press a button! I have some samples I created as well as the student projects linked here.


1st Grade Community Maps

samplemap1Today 1st grade students at Chamberlayne Elementary created their own community maps using ScribbleMaps (SOL1.4 & 1.5). Since I knew it would be kind of tricky for 1st graders to find their school on the map, I put a direct link to it in their classroom folder on the computers. With ScribbleMaps, there’s no log in so we could get started right away. First we talked about what we saw on the map and how it showed their community from above. We located their school and the different parts (playground, bus loop, cafeteria, their classroom, etc.), and we also located the nearby shopping center. I showed them how to select a color and size for the marker tool and they drew on the roads. Then we clicked the “Create a Legend” link in the top left, and they added a colored line to the map key identifying it as a road. Next we discussed how maps often use symbols for places, so we clicked on the “Place Marker” tool and added a symbol of a school to our maps (it can be found in the Places folder under “Geology/Locations”). We also added that same symbol to our map key. Finally we went to the folder called “Places-High Detail” and found a symbol of our choice to represent the shopping center. We added that to the map and to our map key. Each symbol on the map has a label so we labeled the school “Chamberlayne Elementary” and the shopping center “Dollar General.” Some students went on to add descriptive sentences (photos can also be added to the labels). Since I wanted to publish all of their maps to one page for easy access, I created a form for them to copy and paste their links (I had to help with this). Then I published the results here.