Tag: GoogleMaps

5th Grade Midwest Region Math

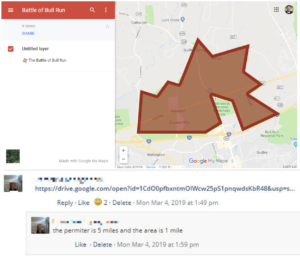
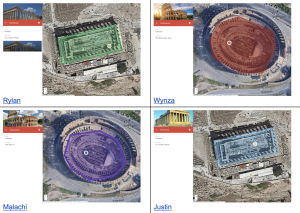
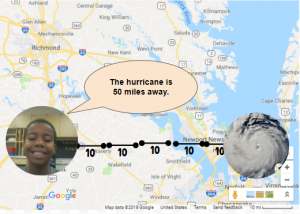
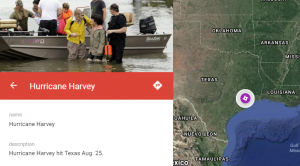
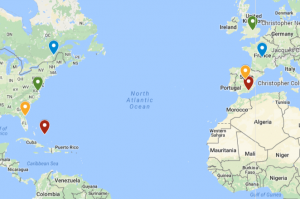
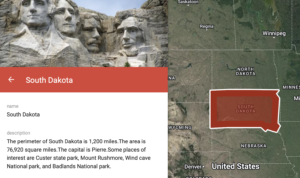
Fifth graders at Laburnum Elementary have been exploring the midwest region of the United States in Social Studies, and they have been learning about perimeter and area in Math (SOL5.8). So today, students in Ms. Hall’s class used My Google Maps to find the perimeter and area of a midwestern state and create a brief state report. First, we reviewed the states in the midwest region: Illinois, Indiana, Iowa, Kansas, Michigan, Minnesota, Missouri, Nebraska, North Dakota, Ohio, South Dakota, and Wisconsin. The students chose one they found interesting and researched it online to make sure it was the state they wanted to do. Next, we went to My Google Maps and clicked “Create a New Map.” We changed the title to the name of our chosen state. Then I showed them how to use the drawing tool to draw an outline of the state. I also showed them how to customize the line thickness and the fill color (after you save the shape, click the paint bucket tool). One of the cool features of My Google Maps is that it shows you the perimeter and the area of any shape you draw. So the students typed the perimeter and area of their state in the pop-up information box, with the correct units: miles and square miles. They also added some of the facts about their state that they discovered in their research. We clicked the camera icon to add a few photos of our state. Finally, with the extra time we had at the end, I demonstrated how they could search for their school and put a pin on it. The pin can be customized, as well, by clicking the paint bucket tool. We shared our maps so anyone with the link could view them, and we pasted the links in Schoology. You can see some of their projects here.


4th Grade Battlefield Perimeter & Area

Fourth graders at Trevvett Elementary have been learning about perimeter and area in Math (SOL4.7) and Civil War battles in History (VS.7b). Today students in Ms. Reed’s class used Google Maps to find the perimeter and area of Manassas Battlefield, where the Battle of Bull Run was fought in 1861. It was the site of the first major battle of the Civil War, and it’s now a national park. First, we explored it with regular Google maps so we could take a virtual field trip there. We turned on satellite view (bottom left corner) and clicked the yellow guy in the bottom right corner (also known as Pegman). When you click on him, you will see blue lines and blue dots. The blue lines show street view, but the blue dots give you a 360 degree view of those sites. Sometimes they are even inside of buildings and museums! So Pegman is a fantastic way to take virtual field trips (TIP: Try dragging Pegman over Hawaii or Nevada, and see what he turns into)! After exploring the battlefield in Google Maps, I asked the students to estimate its perimeter and area. I explained that in the next step we would actually measure its perimeter and area and see whose estimate was closest. My Google Maps is a great way to create, customize and save your own maps. To get started, we clicked the red button “Create a new map.” In the search box we typed “Manassas Battlefield” and arrived at the site. Then I showed them how to use the drawing tool to outline the battlefield. It took a bit of practice, but once the outline was complete, we gave it a title, typed a description, added a photo or two, and hit the Save button. When we clicked back on the outline, a box popped up with some cool features. We could change the outline and fill color with the paint bucket, but more importantly, it told us the area and perimeter of the outline! To finish the project, we clicked the Share button, changed the settings so anyone with the link could view the map, copied the link, and pasted it into Schoology. The students also typed the perimeter and area into the comments so they could compare their findings with their classmates’. You can see some of their maps and comments here.


3rd Grade Perimeter & Ancient Architecture

Third graders at Trevvett Elementary have been learning about ancient civilizations in History (SOL3.3) and how to measure perimeter in Math (SOL3.8a), so today, students in Ms. Robinson’s class measured the perimeter of the Parthenon and the Colosseum with Google Maps. First, we explored both structures in Google Earth. Google Earth is an amazing tool that not only allows you to view buildings in 3D, but you can actually look around inside them with 360 photos (click the little man icon in the lower right corner, then click on a blue dot near a building). As we explored each building, we estimated their perimeters. Next, we went to My Google Maps. Google Maps has a different set of features that allows you to create and save your own custom maps. We located the Parthenon and the Colosseum and placed a marker on each one using the marker tool. I showed them how to customize the pin by typing information, adding a photo, changing the pin color, and adding an icon. Then we used the shape tool to draw a shape around the perimeter of each building. Shapes can be customized as well, using the paint bucket tool to change their color, border size and transparency. Once the “Save” button is clicked, the perimeter and area of the shape can be found in the bottom of the pop-up box. Students compared their earlier estimates with the actual measurements. Finally, we published our maps and shared them on Schoology. You can see them all here.


2nd Grade Extreme Weather Skip Counting Maps

Second graders at Laburnum Elementary have been learning about extreme weather in Science (SOL2.6), skip counting in Math (SOL2.2a), and map skills in History (SOL2.1b). So today, students in Ms. Pope’s class reviewed all three concepts with a Google Drawing project. First, the students decided if they wanted to skip count by 2’s, 5’s, or 10’s, and they chose the corresponding template (you can copy each template by going here). Next, we right-clicked on one image holder and replaced it with a picture of some type of extreme weather (hurricane, tornado, blizzard, flood, etc.) using the “Replace image > Search the web” button. We added our own photo to the other image holder using “Replace image > Camera.” I encouraged the students to look surprised or scared in their photos since the extreme weather was heading their way! Now it was time to practice skip counting. We moved the map scale segments from the bottom to create a line showing the distance from the weather image to our photo. Then we skip counted the segments. Finally, we changed the words inside one of the speech bubbles to say something like, “The weather is ___ miles away.” You can see all their projects here.


4th Grade Mapping the Hurricanes

Fourth graders at Holladay Elementary have been learning about weather in Science (SOL4.6) and maps in Social Studies (SOL4.1), so today students in Mr. Rivara’s class created Google maps showing this season’s hurricanes. The 2017 hurricane season has been rough, with Hurricane Harvey hitting Texas at the end of August, and Hurricane Irma currently hitting Florida! First I showed them a few webtools that are great for tracking hurricanes: Earth and Meteoearth both show wind directions across a 3-D globe, while Windy shows wind directions on a flat map. Next, we went to My Google Maps and created a new map. I showed them how to add a marker to show where Hurricane Harvey hit in Texas. We added a title and a descriptive sentence with a fact about the hurricane. The students had to do some quick research to get their fact by opening a new tab and typing “Hurricane Harvey” in the search box. I wanted them to find a fact with a number, since they are learning about place value in Math (SOL4.1a). Finally, we added a photo of the hurricane, and I explained how to customize the marker by changing the color and icon. We had time to add one more marker for Hurricane Irma. They will continue using the map to track other hurricanes this season. You can see all their maps here.


5th Grade Circles On The Earth

Fifth graders at Laburnum Elementary are learning about circles and their measurements: circumference, diameter, radius, and chord (SOL5.9). Today students in Ms. Henry’s class learned how to show those measurements with Google Drawings and Google Earth. First I gave them each a copy of a blank Google slideshow in Google classroom. We created a title page on the first slide, and on the second slide I showed them how to use the shapes tool to make 4 circles (hold Shift while clicking and dragging the circle to make it perfectly round). We used the paint bucket tool to change the fill color of the circles, and they discovered another new feature that I didn’t know about (I already mentioned in this post, how students found the gradient feature). If you click Custom at the bottom of the colors panel, you can adjust the fill colors’ transparency! Next, I showed them how to use the Line tool to draw a radius, diameter, and chord on different circles. We changed the color of the lines and their thicknesses using the buttons in the toolbar. Then we labeled each measurement with a text box. For the last slide I wanted them to find a real life circle in Google Earth and measure its radius, diameter or a chord. So we went to Google Maps, clicked the Google Earth button in the bottom left corner, and searched for circles. TIPS: Look near rivers for water treatment plants, look out west for crop circles (the panhandle of Texas especially), look on the roofs of buildings for fans, look in backyards for pools and trampolines. To make a measurement, right click where you want the line to start, choose “Measure distance,” then double-click where you want the line to end. Finally, students took a screenshot of their real life circle (using the Snipping Tool) and pasted it to their slideshow with a text box explaining the measurement. You can see all their slideshows here.


3rd Grade Explorers Spreadsheet & Map

Third graders at Laburnum Elementary have been learning about the first European explorers in the New World (SOL3.5c,d). Today students in Ms. Burgess’ class learned how to enter data about the explorers into a spreadsheet and upload it into a Google map. I gave each student a copy of an “Explorers Spreadsheet” (you can make a copy of the spreadsheet here). The explorers’ names are already on the spreadsheet, but students had to do research to enter the remaining information – sponsor country, final destination, and length of trip. For the length of the trip, we first tried finding the mileage of the trip, but realized it was easier to find the length of the trip in days. We were surprised by what we discovered in our research because the lengths of the various trips were very different from our initial predictions. After we entered the data, we highlighted it all and clicked the graph button to make a bar graph. Next we went to “My Google Maps” and clicked the “Add Layer” button. We imported our spreadsheet from Google Drive and checked off “Sponsor” for the placemarks and “Explorer” for the label. Then Google maps automatically created the placemarks in the correct spots. To create an additional set of placemarks for the destinations, we repeated the steps above, but checked off “Landed” for the placemarks. Finally, students could customize the placemarkers by changing the colors and adding photos. You can see a sample spreadsheet here (they were all pretty much the same) and a sample map here.


3rd Grade Measuring the Colosseum

Third graders at Holladay Elementary have been studying ancient Greece and Rome in Social Studies (SOL3.1) and measurement in Math (SOL3.9). Today students in Ms. Middleton’s class practiced measuring the Roman Colosseum using Google maps. I previously taught a lesson on measuring the Parthenon, but I wanted to show them the new 3-D feature, so we looked at the Colosseum today (the Parthenon isn’t in 3-D yet). First we found Italy on the map and discussed its shape (peninsula) and the Mediterranean Sea that surrounds it. Then we zoomed into Rome and looked for the Colosseum (it’s called “Colosseo” on the map). Once we were close enough to see its circular shape, we switched to Google Earth view (click the button in the bottom left corner) and clicked the 3-D button on the right. I showed the students how to hold down the CTRL key and click and drag to rotate the view. They were amazed that all the buildings and terrain were in 3-D! It’s a great way to show students the hilly landscape. It also helps develop map skills (SOL3.4). Now it was time to measure the Colosseum. We discussed what unit we should use, and we made an estimate on Padlet. Then we right clicked on one side of the Colosseum and clicked “Measure Distance.” When we clicked the other side, it automatically gave us the distance across. We used the Snipping Tool to take a screenshot, and we uploaded our screenshots to the Padlet. You can see them all here.


4th Grade Jamestown Maps

Fourth graders at Trevvett Elementary have been studying Jamestown, the first permanent English settlement in America (VS.3), and they recently took a field trip there. Today students in Ms. Harlow’s class reflected on their trip and what they have learned. I posted a link to My Google Maps on Google classroom. My Google Maps allows you to create your own map (you can also access it through your Google Drive by clicking New > More > Google My Maps). We titled our map “Jamestown,” and I showed them how to find Jamestown by zooming instead of using the search box. First, we switched to Google Earth view (click the box in the bottom left corner) and zoomed into Virginia. Then we found the James River and zoomed into one of the big bends in the river. As we zoomed in, we saw Jamestown appear on the north bank. We continued to zoom into Jamestown until we saw the park and the dock. Students were amazed that they could actually see the ships, the fort, and the Powhatan Indian village. They already knew that the park isn’t the true location of Jamestown, but we were able to find the true location nearby. I showed them how to add markers to different parts of the map. They wrote a description for each marker, explaining what they learned or what surprised them at that spot. I also showed them how to click the camera button and add a photo. Finally we gave our map some finishing touches by customizing the markers (click the paint bucket, and you can change its color and the icon on the marker). We clicked the Share button and shared our maps with “anyone with the link.” The students posted their links to Google classroom, but you can see them all here.


3rd Grade Ancient Civilizations Maps

CaptureThird graders at Davis Elementary have been preparing diligently for the upcoming SOL Tests. To help them review their map skills and the ancient civilizations of Greece, Rome, and Mali (SOL3.4), students in Ms. Parkinson’s class created ancient civilization maps using Google maps today. First I posted a link to My Google Maps on Google classroom. Students clicked the “Create a new map” button and typed a title like “3rd Grade Review.” Then we tried to find important landmarks for each civilization without using the “Search” feature. For Greece, we located the Parthenon in Athens, and placed a marker on it. I showed them how to add a picture to the marker and customize the map icon. We placed a similar marker on the Colosseum in Rome and on Timbuktu in Mali. For our last location, I wanted to show them how to create a custom icon, so we found Davis Elementary on the map and placed a marker on it. We clicked the paint bucket > More icons > Custom icon > Webcam and took a photo of ourselves. Then we selected that photo as our marker icon for Davis. Finally we shared our maps to “Anyone with the link” and pasted the links on Google classroom for everyone to see. You can see them all here. Be sure to zoom into each marker to see the actual buildings.