Category: Math

1st Grade LogoMakr Templates

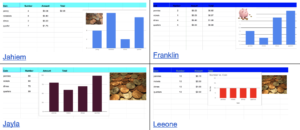
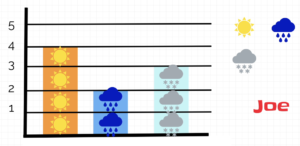
LogoMakr is a cool website for making logos. It has a great library of clip art and customizable text. But one of the things I like most about using LogoMakr in the classroom is you can design templates with it for your students to use. Just set up the page with the text and images you want, then save it, and send the link to students. They can change it up as much as they want, and when they save it, it gives them a new link, so your original template isn’t changed at all. For lower grades it’s especially great because it doesn’t ask them to sign in to use it. Here are two examples I used with first grade students at Laburnum Elementary today: In one class we made fractions (SOL1.4). The students changed the colors of the shapes in my template and typed the fractions in the text boxes. Then they made their own fraction with the shapes tool. In another class we created weather graphs (Math SOL1.12 & Science SOL1.7). The students dragged the weather symbols to make a pictograph, then they dragged the bars to make a bar graph. They also changed the colors of the bars. You are welcome to use these templates or adapt them as you wish. Try LogoMakr with your class!


3rd Grade Coin Calculator

Third graders at Laburnum Elementary have been learning about coins and money (SOL3.6), so today students in Ms. White’s class made coin calculators with Google Sheets. I gave them a template to get started (you can make a copy of it here). It has the header row already filled out. I showed the students how to change the font and color of the row by clicking the #1 on the left side and highlighting the whole row. Next we listed all the coins in column A: quarter, dime, nickel, penny. In column B they could type any number they wanted between 1-10 for the number of coins. In column C we wrote some code to calculate the value of that number of coins by multiplying the number in B with the decimal value of the coin. For example, the code for quarters is: =B2*0.25. So if there were 7 quarters, the code would solve 7 x 0.25 = $1.75. I showed them how to format Column C to display the numbers as currency (Format > Number > Currency). We typed code for each coin and tested it by typing different numbers in column B. The students were very excited to see their code actually working! Then we added an image of money and pressed the Chart button to make a bar graph of the number of coins. Finally we clicked the Share button and set it so anyone with the link could find it. We published our spreadsheets on Schoology, but you can see them all here.


3rd Grade Making Change Comics

Third graders at Varina Elementary have been learning how to make change from $5.00 or less (SOL3.6c). Today, students in Ms. Hummel’s class created comics about different situations that involve making change. We used a great website for making comics called StoryboardThat. The comics had three panels: (1) in the first panel they had to tell how much the good or service cost, (2) in the second panel they had to tell how much money was paid, and (3) in the last panel they had to calculate the change that was given. StoryboardThat makes it easy to be creative because there are so many different backgrounds, and each character is completely customizable with different colors, facial expressions, and poses. We used the built-in, searchable clip art library to find additional objects for our comics like dollar bills and coins. Then students added speech bubbles (called textables) and practiced writing complete sentences with capitals and periods. They also learned how to add the $ dollar sign by pressing Shift and 4. Finally, we took screenshots of our comics and shared them on Schoology. You can see all their comics here. UPDATE: I’ve added additional comics from other classes to this document.


Tags:


5th Grade Variables with Scratch

Fifth graders at Laburnum Elementary have been learning about variables in Math (SOL5.19). Today, students in Ms. Hall’s class used variables and code to create mini math games using Scratch. I started out explaining the idea behind the math game: a character would ask for the players’ name, it would calculate the number of letters in the name, then create a multiplication problem with that number and a random number between 1 and 12. The player would try to solve the problem, and the character would let them know if they were right or wrong. Students could use their own creativity to modify the game however they wished. First, we selected a background and a character (called a sprite) in Scratch. Then, we went into the sprite’s costumes and used the paint tools to make a happy costume for the correct answer and a sad costume for the wrong answer. Now it was time to build the code with variables. I pointed out that a variable is just something that can change. So the player’s name is a variable, the number of letters in the name is a variable, the random number is a variable, and the player’s answer to the multiplication problem is a variable. In Scratch, you define variables using a piece of code that basically says, “Set (variable) to (whatever you define it as).” The variables are displayed in the top corner of the game to keep track of them, but you can delete those if you want. After defining the variables, the students added some “if-then-else” code so that if the answer is correct it would display the happy costume, otherwise it would display the sad costume. The character could also make a statement, if they wished. Finally, we shared our links on Schoology and tested each others’ games. You can see all their Scratch creations here (just click on their names under each picture). Be sure to click the “See Inside” button to view their code.


3rd Grade Famous Americans Elasped Time

Third graders at Trevvett Elementary have been reviewing famous Americans in Social Studies (SOL2.4) and learning about elapsed time in Math (SOL3.9b). So today students in Ms. Peay’s class created comics about famous Americans and the elapsed time of their well-known activities. First we talked about some possible activities and their duration. For example, how long would it take Cesar Chavez to work in the fields? How long would it take for Martin Luther King, Jr. to give a speech? How long would Rosa Parks ride in the bus? Then we discussed two different ways to ask about elapsed time: we could give the start and end times and ask about the duration, or we could give the start time and the duration, and ask about the end time. Once they planned out what they wanted to do, the students went to StoryboardThat, which is a great tool for making comics. They created comics with three panels. The first two panels had to give information about the person, their activity, and the times, while the last panel had to ask the reader a question about elapsed time. We posted our comics on Schoology, and our classmates had to reply with the answers to our questions. You can see some student samples and their comments here.


Tags:


4th Grade Probability Spinners

Fourth graders at Varina Elementary have been learning about probability (SOL4.13) and graphing (SOL4.14), so today students in Ms. Connell’s class created probability spinners and graphed the results. First, they chose a topic for their probability spinner, such as sports, animals, shoes, colors, games, foods, etc. Next, they opened a Google sheet and typed a list of items that belong with that topic in Column A (for example, if they chose sports, they might type baseball, soccer, football, basketball, etc.). I instructed them to list some items more than others to increase the probability for those items. Then we copied all of Column A and went to WheelDecide, which is a free, customizable, online spinner. We clicked the “Paste List” button and pasted our list into the box. Now we have a spinner with all our items on it. Back in our spreadsheet, in Column B, we predicted whether it would be “Likely” or “Unlikely” for each item to be selected by the spinner. Of course, multiple items would be more likely. We tested our predictions by spinning the spinner 24 times and tallied the results. Finally, we recorded the results in Column C of our spreadsheet and clicked the “Insert Chart” button to generate a bar graph of our data. You can see the students’ spinners and spreadsheets here.


3rd Grade Life Cycle Animations

Third graders at Holladay Elementary have been learning about animal life cycles in Science (SOL3.8b) and time in Math (SOL3.9), so today students in Ms. Pumphrey’s class created animated life cycles showing the time duration of each stage. First, they chose an animal and used the Internet to research the animal’s life cycle. I instructed them to focus on how long each stage lasted, and if they couldn’t find that information, they could used the microphone and ask Google (for example, “How long is the egg stage of a ladybug life cycle?”). We were surprised by how short and how long some of the stages lasted! Next, we went to BrushNinja, which is a free online animation tool, and illustrated our animal’s life cycle. We used the text tool to type how many days or months each stage lasted. Then we exported our animations as GIF files and shared them with our classmates in Schoology. You can see a few student samples here.


5th Grade Tree Diagram Comics

Fifth graders at Laburnum Elementary have been learning about probability (SOL5.15), and one strategy they use for figuring out all the possible outcomes is to make a tree diagram. So today, students in Ms. Burgess’ class created tree diagram comics with StoryboardThat. First, they logged into the site with their Google accounts and added a Scene to the first panel. Then they imagined different combinations of objects that would fit that scene (like foods at a restaurant or outfits at a party). They added some Characters and objects that matched their scenario. In the center panel, they constructed their tree diagram using Textables and Lines. We used Textables instead of Shapes so we could easily type inside of them. They started with one category (2 meats or 3 shirts, for example) and added additional categories to their tree. Two or three different categories are all that can fit in the panel space. To save time, I showed them how to copy and paste elements with the “Duplicate” button (it looks like two pieces of paper). Finally, in the last panel, they used the tree diagram or the Fundamental Counting Principle (multiplying by all the amounts in each category like 2 shirts x 2 pants x 3 shoes) to figure out the total possible outcomes. You can see a couple of sample projects here.


Tags:


3rd Grade Perimeter & Ancient Architecture

Third graders at Trevvett Elementary have been learning about ancient civilizations in History (SOL3.3) and how to measure perimeter in Math (SOL3.8a), so today, students in Ms. Robinson’s class measured the perimeter of the Parthenon and the Colosseum with Google Maps. First, we explored both structures in Google Earth. Google Earth is an amazing tool that not only allows you to view buildings in 3D, but you can actually look around inside them with 360 photos (click the little man icon in the lower right corner, then click on a blue dot near a building). As we explored each building, we estimated their perimeters. Next, we went to My Google Maps. Google Maps has a different set of features that allows you to create and save your own custom maps. We located the Parthenon and the Colosseum and placed a marker on each one using the marker tool. I showed them how to customize the pin by typing information, adding a photo, changing the pin color, and adding an icon. Then we used the shape tool to draw a shape around the perimeter of each building. Shapes can be customized as well, using the paint bucket tool to change their color, border size and transparency. Once the “Save” button is clicked, the perimeter and area of the shape can be found in the bottom of the pop-up box. Students compared their earlier estimates with the actual measurements. Finally, we published our maps and shared them on Schoology. You can see them all here.


2nd Grade Habitat Place Value Comics

Second graders at Laburnum Elementary have been learning about place value (Math SOL2.1) and habitats (Science SOL2.5), so today, students in Ms. Brouillard’s class created comics showing an animal in its habitat discussing place value. First, students chose an animal and researched online to learn where it lives and what it eats. Some students even found out exactly how much food it eats (for example, you can ask Google, “How many fish does a bear eat each day?” or “How many pounds of bamboo does a panda eat each day?”). Then, we went to StoryboardThat and found some backgrounds that match the animal’s habitat. We dragged those into the comic panels, searched for our animal in the Characters tab and added it to the comic. Next, we added the food that the animal eats (using the Search feature if we couldn’t find it in Characters). The Textables tab is where the speech bubbles are found. Students added speech bubbles to the comic and typed one sentence about the animal including a 2-digit number and another sentence asking a place value question about that number. We saved our comics and shared them with our classmates on Schoology. Finally, we looked at each others’ comics and tried to answer the questions. You can see some student samples here.


Tags: