Author: David

1st Grade Services with -ing words

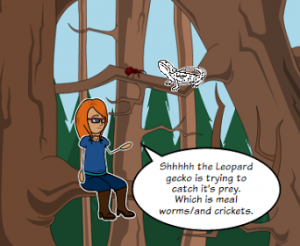
First graders at Holladay Elementary have been learning about goods and services (SOL1.7) and -ing words (SOL1.6e). So today students in Ms. Wimmer’s class wrote sentences about people who provide services, and we used -ing words to describe their work. First we reviewed some of the services they’ve been learning about: firefighters, policemen, barbers, teachers, doctors, etc. Then we talked about action words that end with -ing to describe what these community helpers do: helping, teaching, cutting, etc. (A great site to review services is Scholastic’s Listen & Read. It has several short articles about various services which can be read aloud). Next we used ABCYa! Storymaker to write and illustrate our sentences. The students used the paint tools to draw a picture of the service, then they wrote a complete sentence starting with “He/She is” and ending with an “-ing” word describing what they do. We took a screenshot of each student’s work (using the Snipping Tool) and uploaded them to CoMemories. You can see them all here.


5th Grade Cereal Box Book Report Videos

Fifth graders in Ms. Catlett’s class at Trevvett Elementary have been working on cereal box book reports (SOL5.2 & 5.3). If you want to learn more about the project and the rubric used to evaluate it click here. My job was to show them how to create a video for their project. We used WeVideo, and signed in with their Google accounts. The students clicked “Create a new video,” and we switched to Storyboard Mode (click the three lines in the top left corner). Then we clicked the “Title” slide in the bottom and edited it by clicking the pencil icon. I showed them how to do a Google image search for their book cover. We downloaded it from the Internet (right click on the image and click “Save image as…”), then we uploaded it to WeVideo (click the green cloud icon). Next the students clicked the red record button, installed the WeVideo extension, and recorded themselves describing their book and their cereal box. When they were finished, they added a text slide with “The End.” Finally, we clicked the Themes button and changed the theme of the movie. Each theme has its own accompanying music, so we had to turn that down using the volume slider in Timeline Mode (click the three lines in the top left corner again). To publish the videos, we clicked “Finish” and copied the link into Google classroom. You can see them all here.


Kindergarten Measuring with Nonstandard Units

Kindergarten students at Trevvett Elementary have been learning about bears and hibernation in science (SOLK.6,K.7) and about measurement in math (SOLK.10). Today students in Ms. Sharpe’s class used ABCYa!Paint to draw a bear and measure it with nonstandard units. First we reviewed how to click and drag to paint, then the students clicked the paintbrush, chose a color, and drew a big bear. As they drew their bears, we discussed the special features bears have (ears, tail, claws, teeth, fur, etc.), and I displayed some photos of real bears for their reference. Next I showed them how to use the stickers to find a nonstandard unit of measurement. They had to click the “Categories” button to choose a type of sticker, like “Sports,” “Birthday,” or “Yum.” We reviewed how they had to use the same sticker for their measurements, and they had to stack them one on top of the other to be accurate. Some students were able to make two measurements with different units and compare them (like the image on this blog post). We didn’t put the answers on the pictures because we wanted Ms. Sharpe to use them as a review. So I exported their drawings and uploaded them to CoMemories (a great site for easily sharing photos). Now Ms. Sharpe, or even parents, can go to that site and look through the images to review measurement and/or bear facts. You can see them all here.


5th Grade Figurative Language Animations

Fifth graders at Trevvett Elementary have been learning about different types of figurative language such as simile, metaphor, hyperbole, and personification (SOL5.4d). Today students in Ms. Capano’s class created animations to make figurative language sentences come to life! First we shared examples of figurative language that they had heard before. We brainstormed different ways you could illustrate the literal meaning of well-known phrases, like “faster than a speeding bullet” or “slow as a turtle.” I explained that today they needed to create their own sentence with figurative language. Then we would make an animated GIF that flashed back and forth between the literal and figurative meaning of their sentence. We went to ABCYa! Animate to create the animation. We used the text tool to type our sentence, and I showed them how to use the drawing tools to illustrate it. Next we clicked the copy cat button and changed the picture to show the literal meaning. When we were finished, we saved our animations using the export button and uploaded them to a Media Album in Schoology. You can take a look at their finished animations here.


5th Grade Probability Polls

Fifth graders at Laburnum Elementary have been learning about probability in math (SOL5.14). Today students in Mr. Hofilena’s class created probability slideshows with the new polling feature. First I posted a link to the Poll Everywhere extension on Google classroom so we could install this necessary extension before we got started (just click the Install button and follow the on-screen instructions). Then the students opened a copy of a blank Google slideshow and wrote their title and name on the first slide. I showed them how to change the theme, background color, and fonts. We also added some animation to the text. On the next slide, we used the shapes tool to draw different colored shapes (click the shape, then click and drag on the slide, and use the paint bucked to change its fill color). We discussed the probability of picking a certain color or shape. Now it was time to add the new polling feature. We clicked the Poll Everywhere button at the top of our slideshow (it appears once you add the extension), and chose “Insert > Poll.” We typed our question: “What is the probability of selecting ____?” Then we typed our answer choices: Certain, Likely, Unlikely, Impossible. To share the slideshow with our class, we clicked File > Publish to the web, and copied/pasted the link to Google classroom. When students viewed each others’ slideshows, they clicked the link on the polling page and answered the question. Finally, after everyone had voted, the students went back to their own slideshow and clicked Poll Everywhere > Insert > Screenshot to create a new slide with the results. You can see them all here.


4th Grade Revolutionary War Websites

Fourth graders at Holladay Elementary have been learning all about the Revolutionary War (VS.5) and nonfiction text elements (SOL4.6). Today students in Ms. Zimmerman’s class chose a Revolutionary War battle or person and created an informative website about the topic using the new Google sites. Google sites has made some dramatic changes in its layout and interface that allow you to create a great-looking site in minutes. The students logged into their Google drive, then clicked New > More > Google Sites. They typed the name of their Revolutionary War battle or person in the title box. Next they chose a theme for their website by clicking the Themes tab on the right. The theme changes the default fonts, colors, and layout of the site. We clicked back on the Insert tab and added a text box. The students changed it to a Heading (SOL4.6a) using the dropdown menu and typed “Facts about ___ (their topic)” Now it was time to do some research. We opened a new tab in the browser and searched for our battle or famous person. The students could also use their class notes. I discussed the importance of writing the facts in their own words and the problems that could result from plagiarism. Back on their website, the students added another text box and typed their facts using the bullets option. I showed them how to add an image by clicking the Images button on the right and doing a Google search for their battle or person. In order to make a caption (another nonfiction text element they’ve learned about), we had to double click on the section with the photo, chose Text from the popup menu, and type our caption. We changed it to a Subheading so it would stand out. Finally we added a map (since graphics are an important part of nonfiction text) by clicking the Map button in the Insert panel and searched for the location of the battle or a place of importance in the person’s life. The students added a caption to explain the map, then we published our websites using the Publish button. You may want to check under “Settings” to be sure that it is public on the web. We posted the links to our websites on Google classroom, but you can see them all here.


3rd Grade Temperature Predictions & Comparisons

Third graders at Holladay Elementary have been learning about the motions of the Earth in Science (SOL3.8a) and temperature in Math (SOL3.13). Today we predicted, researched, and compared temperatures from around the world, and then discussed reasons why they were so different. I gave each student a copy of a blank Google slideshow, and showed them how to create the title slide, “Temperature.” I also showed them how to change the theme. Then we added a new slide and titled it “Richmond Weather.” Before looking up the current temperature, I asked them to predict the temperature based on what they saw and felt this morning. We used this interactive thermometer to show the temperature. I like how it displays the temperature in Fahrenheit and Celsius and provides a representative photo for different temperatures. We took a screenshot and added it to our slide. Then, we did a Google search for “Richmond weather” to find the current temperature and added the actual temperature to the slide. Many of the students’ predictions were very close. Next, we wanted to see what the weather was like in some other part of the world. The students could pick a city or country of their choice. Holladay has students from all over, so many of them picked their home countries–China, Vietnam, Mexico, El Salvador, and more. When they typed the name of their city/country and “weather” in a Google search, they found the current temperature and time. We talked about why the time and weather were different (because of the rotation and tilt of the Earth). They adjusted their interactive thermometer to display that temperature, took a screenshot, and pasted it to a new slide. We also added an image of the city/country to the slide (click the image button > Search). Finally we published our slideshows (File > Publish to the web), and pasted the link to Google classroom. You can see them all here.


5th Grade Animal Habitat Comics

Fifth graders at Varina Elementary have been reviewing animal habitats and ecosystems (SOL4.5), so today students in Ms. Rumans’ class created animal habitat comics. We used StoryboardThat to create the comics. First students selected a wild animal of their choice. I told them to pick an animal they were interested in and curious about. To broaden their horizons a bit, we discussed a variety of wild animals so they all didn’t pick cheetahs (which are insanely popular with elementary students for some reason). Once they picked their animals, they had to research their animals’ habitats and food webs. I showed them some quick guidelines for getting the information they needed by typing “name of animal” + “habitat” or “predators” or “prey” into a Google search. We used the basic layout on StoryboardThat with three panels, and each panel had to explain one of these facts. First we used the Scenes tab to get images of the animals’ habitats. Most of the habitats are included in the clip art. However, when it came to adding the animals, the clip art is somewhat limited. So students had to be creative and use animals that looked similar. I think the best example of creative problem-solving was using the hedgehog image for a beaver! I also showed them how to use the search box to look for additional items they needed, like nuts for a squirrel. They quickly found the blood splatter clip art which truly enhanced their predator/prey images. Finally we added the speech bubbles, and students wrote their facts in complete sentences. Some of them got creative with that too, writing it like it was a television documentary. I think you’ll enjoy looking at their final projects here.


3rd Grade Graphing Plant Growth

Third graders at Trevvett Elementary have been studying plants (SOL3.5), measurement (SOL3.9a), and graphing (SOL3.17), so today students in Ms. Hufnell’s class learned how to graph their plant measurements using Google sheets. Over a 4-week period, they have measured and compared the growth of kale and brussels sprouts in the Trevvett Learning Garden. They had their data, and now they were going to analyze their data. I gave them each a blank Google sheets template in Google classroom. Before they recorded their data, we discussed how it should be organized. Should we put the plants in Column A and the dates in Row 1 or the reverse? (Most put plants in Column A). Would that affect the way the graph looked? (It didn’t, necessarily, because of the customization features under Chart Types). I explained that they would need to put their units of measurement as a label on the graph instead of in the data cells, otherwise the graph wouldn’t recognize the numbers (for example, put 5 instead of 5cm). After entering our data, we highlighted it and clicked the graph button. I showed them how to use the Customization tools to change the title and labels on each axis. Then we inserted the chart into our spreadsheet and moved it so it wasn’t covering up our data. Finally, the students clicked the bars to change their colors (use the paint bucket button). The graph made it easy to analyze and compare the plants’ growth. Which plant grew fastest? Which plant grew tallest? Why did the kale not grow at all for 3 weeks? What might be the reasons for the differences since they were both in the same garden with the same sunlight and rainfall? We published our spreadsheets and pasted the links to Google classroom. You can see an example here.


Tags:


1st Grade Equality Animations

First graders at Trevvett have been learning about equality (SOL1.18), so today students in Ms. Lang’s class created equality animations using Sketchtoy. Sketchtoy is a cool web tool that replays whatever you draw, letting you watch the whole process in fast speed. It’s great for showing the steps in solving a problem or illustrating a scientific cycle (like the water cycle or a life cycle). First I showed them how to select a large size pen and a color of their choice. They drew a row of dots, making as many as they wanted, as long as the total number of dots was under 18. Next we selected a smaller pen size and and wrote “=” and the total number of dots. Then the students chose a new color and circled a portion of the dots, writing the number of dots they circled underneath. Finally, they chose one more color, circled the remaining dots, and wrote that number beneath. They also wrote “=” and the total of the two groups. They added some animation (probably their favorite part), and we saved it by clicking the save button. When you save in Sketchtoy, it gives you a link to share. We copied the students’ links and pasted them into a Padlet so they could watch each others’ animations. You can see them all here.