
3rd Grade Temperature Predictions & Comparisons
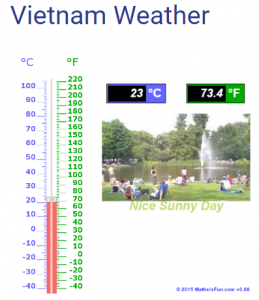 Third graders at Holladay Elementary have been learning about the motions of the Earth in Science (SOL3.8a) and temperature in Math (SOL3.13). Today we predicted, researched, and compared temperatures from around the world, and then discussed reasons why they were so different. I gave each student a copy of a blank Google slideshow, and showed them how to create the title slide, “Temperature.” I also showed them how to change the theme. Then we added a new slide and titled it “Richmond Weather.” Before looking up the current temperature, I asked them to predict the temperature based on what they saw and felt this morning. We used this interactive thermometer to show the temperature. I like how it displays the temperature in Fahrenheit and Celsius and provides a representative photo for different temperatures. We took a screenshot and added it to our slide. Then, we did a Google search for “Richmond weather” to find the current temperature and added the actual temperature to the slide. Many of the students’ predictions were very close. Next, we wanted to see what the weather was like in some other part of the world. The students could pick a city or country of their choice. Holladay has students from all over, so many of them picked their home countries–China, Vietnam, Mexico, El Salvador, and more. When they typed the name of their city/country and “weather” in a Google search, they found the current temperature and time. We talked about why the time and weather were different (because of the rotation and tilt of the Earth). They adjusted their interactive thermometer to display that temperature, took a screenshot, and pasted it to a new slide. We also added an image of the city/country to the slide (click the image button > Search). Finally we published our slideshows (File > Publish to the web), and pasted the link to Google classroom. You can see them all here.