Tag: numbers

4th Grade Perimeter and Area Revised

I posted about a perimeter/area activity for 4th grade a while back, but I had another request for the lesson, and so I revised it a little bit. That one was made in Pages, while this one is made in Numbers in order to use some of the special features of Numbers like formulas. I added a part at the bottom where students could create questions for a partner to solve. They enter the right answer in an “invisible” box and when their partner types an answer and presses the check button, it will tell them whether they are right or wrong. This makes it a little more interactive and students have to be sure they answered their own problems correctly. It can lead to some interesting discussions if the students’ answers don’t match. You can download the file by clicking here.

Tags:


1st Grade Wild Tame Spreadsheet

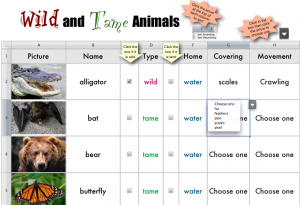
Even first graders can do spreadsheets! On this spreadsheet students identify wild and tame animals (SOL 1.5) They also tell where the animals live, what kinds of body coverings they have, and how they move. There is no typing involved, just selecting the correct information. Once all the data is entered students can click on the different column headings to sort the animals in different ways (like grouping all the water and land animals together or finding all the animals that fly). So this activity also helps your students understand databases. You can download the file by clicking here.


Kindergarten Spelling & Sight Words

A kindergarten teacher wanted her students to practice spelling and sight words with technology so I created two activities that you might find useful, or you can change them to fit your specific words. The first one (pictured) is a Numbers activity to review their spelling words. The students look at the picture by each word and click the sound button to listen to the word read aloud. Then they choose the correct vowel from a drop down menu to complete the word. The spreadsheet is self-correcting so a smile will appear if they are right and a sad face appears if they are wrong. You can download the spelling Numbers activity by clicking here. The second one is a Keynote slideshow to review sight words. Basically the students record themselves reading the words as they appear on the screen, then the teacher has a record of which words the students know. You can download the sight words Keynote activity by clicking here.


3rd Grade Fractions

Third graders at Chamberlayne learned about fractions and formulas today using Numbers. I gave them a template to use that you can download by clicking here. It has three parts. The first part involves making equivalent fractions. The picture changes as the students enter the numbers so they can actually see if the fractions are equal. The second part involves adding fractions. Students try to pick numbers that will create a specific kind of picture. The visual makes it very clear how the two fractions combine together, and it updates automatically with each new number. The third part involves using a formula. The students have to figure out a simple spreadsheet formula that will make the picture match the fraction. Don’t worry, the template includes the answer if your students can’t figure it out. When the students finish the activity they can go to the Inspector and change the appearance of the 3-D pictures (like metal or wood) if they want. Try it out with your class and let me know if you have any questions or suggestions.


Tags:


Attendance Graph with Numbers

Numbers is a cool piece of software and to showcase some of it’s special features I’ve created an attendance activity you can use with your students. It will give them a some graphing experience each morning, and it provides an easy, visual way to take attendance. Just enter your students’ names in the spreadsheet, set them all to ABSENT with one quick drag, and as they enter your room they check off their own names. The graph will automatically update and everyone can see at a glance who’s absent! No more pesky reminders from the office to do your attendance (believe me, I know from experience)! Two special features of Numbers that this showcases are the checkboxes and conditional formatting (that’s how it changed from ABSENT to PRESENT when they checked the box). You can explore the formulas I used by clicking in some of the boxes. Download the activity by clicking here and if you would like to see a demo video click here.


Tags:


Kindergarten Graphs

Today at Trevvett we had a delicious graphing lesson with Lucky Charms in kindergarten. I gave them each a handful of Lucky Charms and a Numbers template to get them started. You can download the template by clicking here. The students sorted their marshmallows into groups and counted them. Then they started entering the numbers into the spreadsheet. As soon as the students press the Enter key after each number, the spreadsheet automatically generates a bar graph with pictures, or a pictograph, of the marshmallows! After the graph is finished the students could ask their neighbor questions like, “Which type of marshmallow had the most? had the fewest? had the same? How many pots of gold did I have? etc.” Then, of course, the students could eat their Lucky Charms!


4th Grade Ordered Pairs Database

In fourth grade at Laburnum today we combined a database lesson with a lesson on ordered pairs. I gave each student a Numbers template which you can download by clicking here. The template has a link to an online form for each student to enter some coordinates for a shape of their choice. They choose the x-coordinate, the y-coordinate, the shape, the color, and type their name. After all the students have entered their data, they open the next link which shows all the records. Now they are ready to enter this information into the Numbers document. As they type in their classmates’ coordinates, the points are automatically plotted on the graph. The final step is to use the Shapes tool to put the correct shape on the correct coordinates and change the fill color to the one specified. You can take a look at this class’s final copy by clicking here.


5th Grade Graphs

One of my fifth grade classes was working on graphing. Since most of these students have been making graphs since first grade, I wanted to focus on something different. Instead of just entering the data into the spreadsheet and making the graph, I wanted the students to experience the value of formulas and what they can do. I created a template where the graph is automatically generated when they enter the data so the students could move quickly to the next step which was writing a word problem about the data. They enter the answer into an “invisible box” then give the word problem to a friend to solve. The power of the hidden formula shows up when the friend checks his or her answer. If it’s wrong, an X automatically appears, and if it’s correct, a check mark appears. It’s almost like magic! Students can continue making up new problems or even change the data entirely. They can also customize the colors of the bars in the graph if they wish. You can download the template by clicking here and you can see the sample graph by clicking on the picture.


4th Grade Geometry & Graphing

Fourth graders at Trevvett were up for a math challenge! They knew all about rays, line segments, parallel lines, intersecting lines, and angles. But could they create them using only a spreadsheet?? I provided them with a Numbers template and they had enter the correct numbers into the spreadsheet to create the geometric figures in line graph form. It required some serious thinking and collaborating, but they did a fantastic job meeting the challenge! You can see an example by clicking here and you can download the template to use by clicking here.


1st Grade Graphs

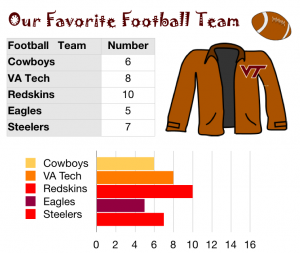
1stFavGraph3In first grade at Holladay today we made graphs of our favorite things using Numbers. I gave the students a template to get them started. You can take a look at what the template looks like by clicking here, and you can download it by clicking here. The students collected their data ahead of time so all they had to do was type in the words and numbers, and the graph was automatically generated by Numbers. Then they went to Pixie, copied some clip art, and pasted it onto their graph. The final results turned out great! Take a look at their favorite Halloween stickers, football teams, animals, and restaurants.