Category: Social Studies

5th Grade Comparing Virginia Rivers

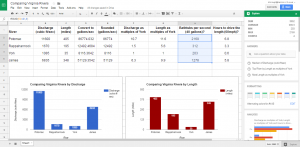
Fifth graders at Laburnum Elementary have been reviewing the rivers of Virginia (VS.2c) and watersheds (SOL4.9) in Social Studies and Science. They have also been multiplying decimals in Math (SOL5.5a). So today students in Mr. Hofilena’s class used those skills to compare Virginia Rivers. First we discussed ways to compare the rivers. Everyone agreed that we should compare the length, but I also suggested comparing the discharge. Discharge is the amount of water flowing down the river, measured in cubic feet per second. We discussed factors that influence discharge: river depth and width, rainfall, and the velocity of the current. Next I gave them a Google Sheets template that you can copy here. The students had to do their own research to find the length and discharge for each river (Google “River name length” and “River name discharge”). They entered the data into the correct cells on the spreadsheet (using only numbers, no units). Then I showed them how to highlight the data and analyze it using the new “Explore” button in the bottom right corner. We used the Insert Chart button (top toolbar) to create graphs of the data. It was interesting to see how the length compared with the discharge. For example, the Rappahannock River is almost 6 times the length of the York, but its discharge is only 1.5 times that of the York. What does that tell us about the two rivers? We didn’t have time to do further comparisons, but I’ve added them to the template. You could convert the discharge to gallons per second with a formula (CELL*7.48052). Then convert that to bathtubs per second (the average bathtub holds 40 gallons) to help students visualize it better. You could also figure out how long it would take to drive the length of the river by dividing the total miles by 60 (assuming you are driving 60 MPH). You could even compare the rivers using the York as the unit. Take a look at a sample here.


4th Grade Jamestown Videos

Fourth graders at Holladay Elementary have been learning about Jamestown (VS.3) and many of them have been on field trips there, so today students in Ms. Rivara’s class created Jamestown videos. They used WeVideo to create their movies. Since this was the second time they’ve used it (their first time is here), their skills improved. We worked with partners again, since WeVideo works better when less computers are online. First we clicked the red record button and filmed our intro. Then the students searched for photos of Jamestown to use in their movie. They uploaded the photos and arranged them in order on the timeline. Next, they pressed the microphone button and recorded a voiceover explaining the photos. Finally the students selected a theme with music. We had to turn down the volume of the music on the timeline and turn up the volume of the voiceover in order to hear it. The students published their videos and posted the links to Google classroom. You can watch some of their videos here.


Tags:


3rd Grade Create a Holiday Logo

Third graders at Trevvett Elementary have been learning about being a good citizen and celebrating national holidays, like Veterans Day (SOL3.11). Students in Ms. Robinson’s class created their own national holiday, and today she asked me to help them make a logo to represent their holiday. First we talked about logos. They are easily recognized symbols with simple designs and just a one or two colors. I showed them a few logos to see if they could recognize them (Apple, T-Mobile, Xbox, Android, Playstation, Olympics, McDonalds, Domino’s, etc). Some logos even have hidden symbols (like the arrow in FedEx, 31 in Baskin Robins, two people sharing a chip in Tostitos, the letter g/face in Goodwill, and the kiss in Hershey Kisses). I explained that the logos they create for their holiday needed to be simple and easily understood, but they could also have hidden messages or surprises. I gave them each a copy of a blank Google doc in Google classroom and showed them how to type the name of their holiday and change the font, size, and color. We discussed the importance of fonts in logos and realized that the most important thing was that it was easy to read. There are not many cursive fonts in logos (Coca-Cola is a famous exception). Next we went to LogoMakr to design our logo. This is a great site for any kind of illustration because there’s no login, it has a huge collection of clip art, you can customize the colors, and your art is quickly downloaded as a PNG file with a transparent background. After students created their logos, we imported them into our Google doc (Insert > Image > Upload from your computer) and wrote about the holiday. Finally we published our work to Google classroom. You can see all the holiday logos here.


4th Grade Jamestown Animated Timelines

Fourth graders at Holladay Elementary have been learning about Jamestown (VS.3), so today students in Ms. Anthony’s class created animated timelines about important events in Jamestown using Google slides. First I gave each student a copy of a blank Google slides template in Google classroom. I showed them how to add a background image of the James River (Background button > Image > Choose) and edit the title and subtitle on the first slide. On the second slide I showed them how to change the background color and use the line tool to create a timeline. We chose 3 important dates for our timeline and typed them in text boxes: 1600 Powhatan Indians live in Virginia, 1607 English arrive at Jamestown, and 1619 First representative government, House of Burgesses. Next we clicked the Image button and searched for pictures of each of these events. The students resized their pictures and moved them to the correct spots on the timeline. They also added animations to the events, making them appear in order. Finally we clicked File > Publish to the web and copied the link to share on Google classroom. You can see some of the students’ timelines here.


3rd Grade Comparing Rules & Laws

captureThird graders at Trevvett Elementary have been learning about the difference between rules and laws (SOL3.10a). The teachers developed a project as an alternative assessment where the students create posters comparing rules and laws, so today Ms. Hufnell’s students made digital posters using Google docs. Some of the students worked with a partner while others worked individually. First I made copies of a blank Google doc for each student in Google classroom. I showed them how to create a fancy title by changing the font, size, and color. Then we inserted a 2×2 table. In the first row, students wrote the rule and the law that they chose. I showed them how to make the important words bold. In the second row students described the rule and law, and I showed them how to make bullet points. Finally, the students clicked Insert > Image > Search and searched for images that reflected the rule and and law they chose. We published our posters to Google classroom so everyone could see them. You can check out some of their projects here.


1st Grade U.S. Symbols Patterns

captureFirst graders at Trevvett Elementary have been learning about patterns in Math (SOL1.17) and U.S. symbols in Social Studies (SOL1.11), so today students in Ms. Lucas’ class created patterns with U.S. symbols using Pixie. First I showed them how to add a text box by clicking the blue T, and they typed their names with a capital letter. Next we clicked the Stickers button and searched for the Symbols folder (it has an orange exclamation point on it). Inside the Symbols folder, there is a folder of American symbols. There are stickers for the four symbols the students have been studying: the American flag, the bald eagle, the Washington Monument, and the Statue of Liberty. I showed the students how to click and drag the stickers onto their document and create a pattern. As they finished their patterns, we exported them using the Export button, and I uploaded them to a photo sharing site called CoMemories. You can see them all here.


Tags:


4th Grade Virginia Indians Videos

pasted-image-0Fourth graders at Holladay Elementary have been learning about the Virginia Indians (VS.2d), so today I showed students in Ms. Tonello’s class how to make videos about a Virginia Indian group using WeVideo. First they picked a partner to work with because WeVideo puts a bit of strain on the wireless bandwidth. Next, we logged in with our Google accounts and switched to Storyboard mode (since it is easier for beginners). Each pair chose a Virginia Indian group (Powhatan, Monacan, Cherokee) and typed the name of their group on the title clip. Then they clicked the red record button and recorded their introduction video. I showed them how to drag their video down from the media frame into the storyboard frame. Next, we opened a new tab and searched for a map of Virginia to include in our video (most used this one since it was part of the Wikimedia commons). They used the Snipping Tool to take a screenshot of the map, and they used the pen tool to circle where their Indian group lived. Then students uploaded the map to their video project and recorded a quick voiceover using the microphone button. We switched to Timeline mode in order to drag the voiceover to match up with the map. Finally we clicked the Themes button and chose a theme with music. We discovered that we needed to turn down the volume of the music track or we couldn’t hear our voices. That’s all we had time for today, so we posted our links to Google classroom with the hopes of finishing them later. Check out a few student examples here.


Tags:


4th Grade Virginia Regions Videos

captureFourth graders at Holladay Elementary have been learning about the regions of Virginia and their products (VS.10b) in Social Studies. Since Ms. Rivara let me know that she wants to do more video projects with her class this year, I taught them how to use WeVideo to create short movies about the regions of Virginia. First we got in self-selected groups, and each group discussed the region they wanted to do. One student from each group signed into WeVideo with their Google account. We switched from Timeline mode to Storyboard mode (using the 3 lines in the top left corner) to use a simpler layout at the beginning. We clicked on the Title slide and added the name of our region. Next I showed them how to use the red record button to record their introduction using the webcam. We added that to our video storyboard by clicking and dragging it. Then we searched online for pictures of our region and added those our video storyboard as well. I explained how to use the microphone button to record a voiceover, and we switched over to Timeline mode (using the 3 lines) so that we could adjust the duration of the photos to match our voiceover. Finally we clicked the Themes button and chose a theme with the effects and music we liked. When the students finished editing their videos, we clicked the Finish button, chose the 480 size to load it faster, and published it. Now we could copy our links and paste them to Google classroom so we could watch each other’s videos. You can see them all here. UPDATE 10/13/2016 Ms. Adamonis’ 4th graders at Trevvett did a similar project which you can see here.


Tags:


4th Grade Bordering States Place Value

border-place-valueFourth graders at Holladay Elementary have been learning about the bordering states in Social Studies (VS.2a) and place value in math (SOL4.1a). Today students in Ms. Zimmerman’s class found the place value of the sizes of the bordering states. I posted a template to Google classroom that you can download here, and I set it so that all the students could edit it. Then I instructed them to research and find out the size of each state. The first student to find the answer wrote it in the correct cell (I explained that it’s like a race, but if they see a color in the cell, that means someone else is already in that one). We discovered that the quickest way to find the answer is to Google “size of [state name].” The template automatically creates a graph of the data. You can see their finished graph here. Next they opened a blank Google doc and selected a bordering state to write about. I showed them how to import the graph (Insert > Chart > From Sheets), and they wrote the area in written form and expanded form. You can take a look at a student sample here.


3rd Grade Ancient Civilizations Maps

CaptureThird graders at Davis Elementary have been preparing diligently for the upcoming SOL Tests. To help them review their map skills and the ancient civilizations of Greece, Rome, and Mali (SOL3.4), students in Ms. Parkinson’s class created ancient civilization maps using Google maps today. First I posted a link to My Google Maps on Google classroom. Students clicked the “Create a new map” button and typed a title like “3rd Grade Review.” Then we tried to find important landmarks for each civilization without using the “Search” feature. For Greece, we located the Parthenon in Athens, and placed a marker on it. I showed them how to add a picture to the marker and customize the map icon. We placed a similar marker on the Colosseum in Rome and on Timbuktu in Mali. For our last location, I wanted to show them how to create a custom icon, so we found Davis Elementary on the map and placed a marker on it. We clicked the paint bucket > More icons > Custom icon > Webcam and took a photo of ourselves. Then we selected that photo as our marker icon for Davis. Finally we shared our maps to “Anyone with the link” and pasted the links on Google classroom for everyone to see. You can see them all here. Be sure to zoom into each marker to see the actual buildings.