Tag: numbers

5th Grade Graphing Latitude Temperatures

5th LatVsTemp Picture
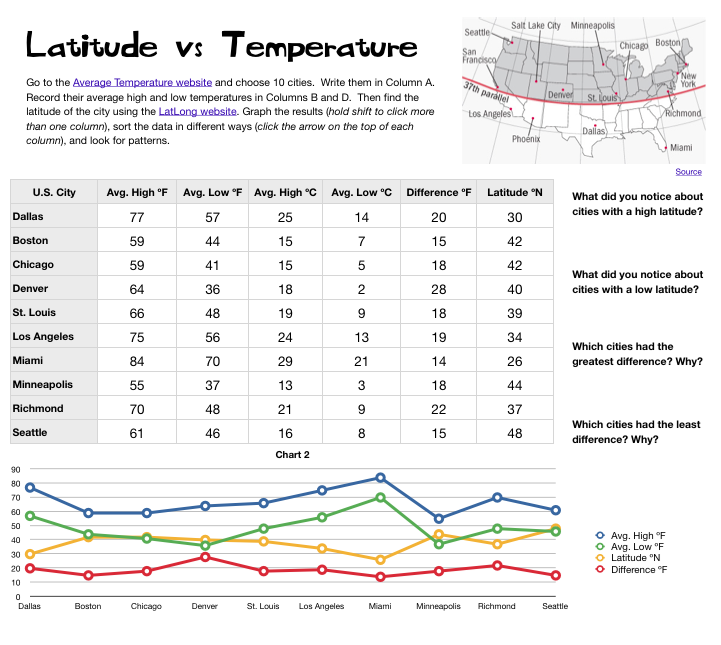
Ms. Elsea at Davis Elementary had a great idea to challenge some of her math students. She wanted them to research the high and low temperatures of cities at different latitudes in the United States. Then she wanted them to compare the data, look for patterns, and try to infer reasons for the differences. So she asked me to help them with the graphing part. I created a Numbers template for them to use that you can download by clicking here. After students entered their data, I showed them how to graph it as a line graph. Even though a line graph is traditionally used for showing changes over time, it works well with this data since there were several things we were looking at and the relationships wouldn’t have been as obvious with a bar graph. Once we graphed the data, some relationships were very clear. As predicted, cities with the lowest latitudes had the highest temperatures. But one of the most surprising pieces of data was that cities in the mid-latitudes had the greatest differences between their high and low temperatures. We discussed possible reasons for that. Then we tried sorting the data in different ways. I showed them how they could click a column heading (like high temperature or latitude) to sort by that category. They were surprised how their graphs automatically changed as well. This lead to more interesting discussions. Overall, the students learned a lot about the relationship between latitudes and temperatures that they can take back to their classmates to share with them.


4th Grade Virginia Resources Graph

Screenshot VA ResourcesFourth graders at Davis Elementary have been learning in science about the different natural resources produced in Virginia (SOL4.9). In math they’ve been learning about graphing. So today we did some research to gather hard data about Virginia’s resources and graphed the information we found using the Mac spreadsheet program, Numbers. First we predicted which resources are the top ones produced in Virginia. Many students guessed coal and tobacco. Next we went online to two sites I created about Virginia’s mineral resources and farm products. (I created my own sites because the sites with the data, which I cited, did not have any pictures so students may not have known what those products were… like I didn’t know what “broilers” were). I pointed out that the data is hard to visualize when it’s just a list of numbers. That’s how graphs help! So the students selected which data they wanted to graph and entered the information into a Numbers template that you can download by clicking here. Then I showed them how to graph the data and customize the colors. Finally they made up a few questions of their own about the data for a partner to answer.


3rd Grade Math Formulas

Screen shot 2013-08-14 at 12.04.29 AMThird graders (and students in other grades as well) are often asked to identify patterns in a series of numbers. For example, given the following series of numbers: 7, 10, 13, 16, students might be asked to identify the next two numbers in the series or describe what mathematical “rule” is creating the pattern (in this case, the rule is “adding 3”). So I figured this was a perfect opportunity to teach the students in Ms. Boone’s class at Chamberlayne Elementary about spreadsheets and formulas. I gave them a Numbers template that you can download by clicking here (I just adjusted the size of the cells and fonts). I told them to enter any 2-digit number into cell B2. Then in cell C2 we wrote a formula “=B2 + 3” and pressed the Enter key. The answer automatically appeared in the cell. Then I showed them how they could click in the cell and drag the little dot in the lower right corner to fill in the neighboring cells and create a pattern. Next they wrote the rule in the box. We continued in a similar manner writing formulas for subtraction, multiplication (use *), and division (use /). Once the students understood how to write formulas, I let them write a formula of their own. Then a partner had to enter a number and see what the “secret” formula did to that number. Their goal was to try to identify the formula or rule that was creating the pattern. Some students discovered that certain numbers (like 0 or 1) were very helpful in figuring it out!


Tags:


3rd Grade Fraction Pies

piechartfractionsThird graders in Mr. Friend’s class are studying fractions, so today I showed them how to make fraction pies using a program called Numbers (the Mac version of Excel). The was the first time many of them had seen a spreadsheet so I explained the parts. The naming of each cell, (A2, B4, etc) was familiar to them because they studied map grids which use a similar format. I explained that we couldn’t just write a fraction like 3/4 in the cells and generate an accurate fraction pie. To show them what happens we typed 3 in A1 and 4 in A2, highlighted them both, clicked the Charts button and picked a pie chart. It made a fraction pie that looked like 3/7. After trying a couple more that way, the students figured out that the computer is taking the top number and making pieces of pie one color, then taking the bottom number and making pieces of pie another color. So they had to “trick” the computer into making the correct pie chart to represent the fraction accurately. In order to get a pie showing 3/4, we had to type 3 on top and 1 underneath. We tried that strategy with a couple of basic fractions until they got it right. Then they made up their own fraction, created a pie chart for it, and their neighbor had to identify the fraction. Before saving their work, I showed them how they could change the colors of the pies (they love that, but I try to save it until the end or they get distracted by it)! If you’d like to try another Numbers activity comparing fractions and showing mixed fractions, look at this post.


Tags:


5th Grade State Names Statistics

LetterFrequencyGraphsFifth graders in Ms. Corfield’s class at Chamberlayne Elementary have been learning about the different states in social studies. They have also been studying mean, median, mode, range, and stem and leaf plots in math. So Ms. Corfield came up with a great idea that would help students review all of these concepts! One of the benefits of project-based learning is the ability to connect cross-curricular topics in one assignment like this example. First the students had to figure out the number each letter occurs in all the states’ names. They could come up with their own strategies for accomplishing this task (some may even discover online tools like this one that count the occurrences of each letter in whatever you type). Once they had their data, they entered it into a template that I created for them. You can download it by clicking here. The template automatically generates a bar and pie graph of the data. The students had to create a stem and leaf plot of the data themselves. A quick way to do this is to sort the numbers by clicking on the heading of Column B and choosing “Sort Ascending” (afterwards they will need to click on the heading of Column A and choose “Sort Ascending” to put everything back in order). Next, students calculated the mean, median, mode, and range of the data. They could use any of the spreadsheet tools available to them to do this. Some will discover that when they highlight all the numbers, the median (average) is automatically calculated over on the bottom left side of the spreadsheet. Letting students make discoveries like this on their own is far more effective than you pointing it out to them. Here’s a final trivia question for you: Which is the only letter that is not found in any state name?


Tags:


4th Grade Number Patterns

4thNumberPatternsFourth graders at Laburnum Elementary have been identifying number patterns which is an important math skill (SOL 4.15), so today I wanted to show them how computers can help create and identify patterns. Since this was the first time many of them had worked with spreadsheets, I gave them a Numbers template to get started. You can download it by clicking here. I just made the cells and the fonts a little larger for clarity. First I explained to the students how the cells work and how they are identified (such as A1 and B2) since that understanding is essential for writing formulas. Next we added the headers “In” (to cell B1) and “Out” (to cell C1) because I wanted to start with simple In-Out formulas. I told them to write a number between 1 and 10 in B2, and then I showed them how to write their first formula in C2. We did an addition formula first: =B2+?. I let them choose another number between 1 and 10 for the “?”. When they pushed Enter, they saw the instant magic of formulas! Next they erased their number in B2 and switched seats with a partner. The partner had to enter numbers into B2 in order to try and figure out what the formula was in C2. Once they figured it out, they wrote the rule in A2. We did a similar process for subtraction =(B3-?), multiplication =(B4*?), and division =(B5/?) formulas. Now that they were familiar with formulas, I had the students create their own patterns using multiple cells. Then their partners had to figure out the patterns and write them in column A. It was a great learning experience, with the students not only gaining a clearer understanding of patterns, but also of how to create spreadsheets. You can see a student sample by clicking the picture.


Tags:


Rounding Decimals & Whole Numbers

Numbers is one of those programs on the laptops that is underutilized by many students. However it is a powerful way to teach your students to think and solve problems, especially when developing formulas on their own. A fourth grade teacher at Chamberlayne wanted me to help her students with rounding, and I immediately thought of using Numbers. Earlier I had created a website for rounding whole numbers called “Rounding Robot.” I decided to incorporate that concept into a Numbers spreadsheet so the students could see the formulas and figure out how they worked. Then they could use that information to develop their own formulas. I created a spreadsheet for rounding whole numbers that you can download by clicking here and one for rounding decimals that you can download by clicking here. The spreadsheets have formulas so that students can check their own work. They can even make up their own numbers. If you use this activity with your students be sure to encourage them to try to make their own rounding formula.


Tags:


1st Grade Fractions

Today first graders at Chamberlayne Elementary explored fractions and made their own using Numbers. At this beginning level, they are just learning about halves and fourths (SOL 1.6) so I created a template for them, focusing on those fractions that you can download by clicking here. It also includes thirds (some of Ms. Johnakin’s students knew them). The students started out by entering different numbers into the fractions and seeing how they changed the pictures. The template is set up to let them know if they entered a wrong number (like 5). Next they made their own half or fourth fraction. I showed them how to use the shapes tool to illustrate the fraction. Then they went to a friends’ desk and illustrated their friends’ fraction. To see a sample, click on the picture to make it larger. For some fun online fractions games click here.


Tags:


Kindergarten Colors Graphs

Do you know what’s the favorite color of most people around the world? According to this international study, blue was preferred across genders, countries, and age groups. (My personal favorite color is orange… what’s yours? Leave a comment 🙂 Today kindergarten students at Laburnum did their own research and created graphs about their favorite colors. I gave them a template that you can download by clicking here. The students collected and added the data. The template is set up to automatically build the graph as the data is entered. Next I showed them how to change the colors of the bars so they matched the colors they represented. When they were finished the students answered the two questions at the bottom. They are set to automatically change the color of the word to match the color and to check if the answer is right or wrong. You can see the picture bigger by clicking on it.


5th Grade Skittles Spreadsheet

Ms. Bradlee, a fifth grade teacher at Chamberlayne Elementary, wanted a way for her students to keep track of their behavior incentive program. She uses a currency of Skittles to reward good behavior, with each color worth a different amount of money. So her students needed to keep a weekly total of their earnings and also the sum throughout the year. I created a template for them to use that you can download by clicking here. But the important part of this lesson is to guide the students through the steps of creating the various formulas. It’s a great way to make math practical and interesting. For each type of Skittle the students had to multiply by the cash value and then add them up. You can see a sample by clicking the picture to make it larger. Notice the complicated formula at the top. The students did that themselves! Now they have a quick way to keep track of their earnings.


Tags: