Tag: GoogleDocs

3rd Grade Explorers Spreadsheet & Map

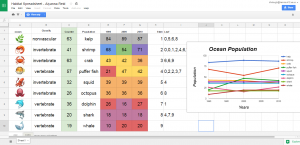
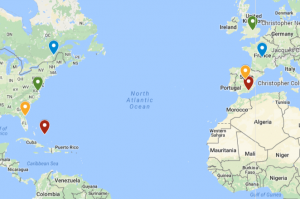
Third graders at Laburnum Elementary have been learning about the first European explorers in the New World (SOL3.5c,d). Today students in Ms. Burgess’ class learned how to enter data about the explorers into a spreadsheet and upload it into a Google map. I gave each student a copy of an “Explorers Spreadsheet” (you can make a copy of the spreadsheet here). The explorers’ names are already on the spreadsheet, but students had to do research to enter the remaining information – sponsor country, final destination, and length of trip. For the length of the trip, we first tried finding the mileage of the trip, but realized it was easier to find the length of the trip in days. We were surprised by what we discovered in our research because the lengths of the various trips were very different from our initial predictions. After we entered the data, we highlighted it all and clicked the graph button to make a bar graph. Next we went to “My Google Maps” and clicked the “Add Layer” button. We imported our spreadsheet from Google Drive and checked off “Sponsor” for the placemarks and “Explorer” for the label. Then Google maps automatically created the placemarks in the correct spots. To create an additional set of placemarks for the destinations, we repeated the steps above, but checked off “Landed” for the placemarks. Finally, students could customize the placemarkers by changing the colors and adding photos. You can see a sample spreadsheet here (they were all pretty much the same) and a sample map here.


5th Grade Shapes with Google Drawings

Fifth graders at Varina Elementary have been learning about 2-D shapes: parts of a circle (SOL5.9), angles and triangles (SOL5.12), and plane figures (SOL5.13). Today, students in Ms. Shiew’s class used Google Drawing to illustrate a variety of these shapes. First we went to their Google drive and clicked New > More > Google Drawings. I showed them how to use the Shapes tool to create a shape then use the paint bucket to change the fill color. The students actually found a new feature I hadn’t seen before–you can now have a gradient fill! I also showed them how to use the line tool to create congruent markers on equal sides of the shapes or to add chord, diameter, or radius lines to the circle. They used the editing tools to change the color, thickness, and endpoints of the lines (and shape outlines). To label the endpoints, students used the text box tool and typed letters. Finally, we clicked File > Download As > PNG Image. I explained that one difference between PNG and JPG images is that the PNG image will have a transparent background. We shared our images on Google classroom with questions for our classmates to answer, like “What is the line AB on the circle?” or “What type of triangle is in my picture?” You can see all their shapes here.


5th Grade Habitat Stem and Leaf Plots

Fifth graders at Holladay Elementary have been learning about stem and leaf plots and line graphs in Math (SOL5.15), and they have been studying ways to classify animals and plants in Science (SOL5.5). Today students in Ms. DiMatteo’s class created stem and leaf plots and line graphs about the populations of animals and plants in different habitats. First I gave each student a copy of this Google spreadsheet (you can make a copy by clicking File > Make a copy). They clicked the arrow in box A1 and chose a habitat from the drop down list. Depending on the habitat they choose, a list of animals and plants appears. Google now has emojis (click Insert > Special Characters > Emoji), so that’s where I got the images. Next the students had to identify each one as an invertebrate, vertebrate, vascular or non-vascular plant. I tried to include at least one of each kind. (You will notice as you edit the spreadsheet the counter numbers change, that’s supposed to happen). Next the students acted like scientists and recorded the data for each year by typing the number in the counter box at that moment. The numbers have conditional formatting rules that will turn them different colors based on their tens digits (to help with the stem and leaf plot). To create the stem and leaf plot, the students type the numbers 1-9 in the Stem column (column H), and record the ones digits in the Leaf column (column I). To create the line graph, the students highlight the data in rows D-G and click the graph/chart button. Then they click the “Chart Types” tab in the window that appears and choose a line graph. They also need to check the box that says, “Switch rows/columns” so each line shows a specific living thing. Finally, I showed them how to customize the colors, titles, and labels of their graphs by clicking on each one. As we looked at our data, we discussed why there were more of the smaller creatures and less of the larger ones, and what would cause populations to increase or decrease. You can take a look at the students’ projects here.


3rd Grade Valentine Machines

Third graders at Holladay Elementary have been learning about simple machines in Science (SOL3.2) and adding and subtracting money in Math (SOL3.8). Today students in Ms. Whittaker’s class created their own Valentine machines with a money math problem for their classmates to solve. First I made a copy of a blank Google slideshow for each student in Google classroom. I showed them how to click the Background button and choose a background color. Next we moved the “Title” textbox to the top of the page, and the students typed a title for their machine. We moved the “Subtitle” textbox to the bottom of the page, and the students typed in a money math problem about their machine (adding two amounts together or calculating change). We did the written part first because that was the most important part, and I wanted to make sure it was finished. I showed them how to change the font, size, and color of their text. Then it was time to draw the machine. I demonstrated how to use the Shapes Tool to create a machine that would deliver Valentines. It could be just one simple machine, or it could be a compound machine, made of several simple machines. After the students drew their machines, they labeled the machine parts with text boxes. Finally we published them to the web (File > Publish to the web) and pasted the links to Google classroom, so we could solve each others’ problems. You can see them all here.


5th Grade Probability Polls

Fifth graders at Laburnum Elementary have been learning about probability in math (SOL5.14). Today students in Mr. Hofilena’s class created probability slideshows with the new polling feature. First I posted a link to the Poll Everywhere extension on Google classroom so we could install this necessary extension before we got started (just click the Install button and follow the on-screen instructions). Then the students opened a copy of a blank Google slideshow and wrote their title and name on the first slide. I showed them how to change the theme, background color, and fonts. We also added some animation to the text. On the next slide, we used the shapes tool to draw different colored shapes (click the shape, then click and drag on the slide, and use the paint bucked to change its fill color). We discussed the probability of picking a certain color or shape. Now it was time to add the new polling feature. We clicked the Poll Everywhere button at the top of our slideshow (it appears once you add the extension), and chose “Insert > Poll.” We typed our question: “What is the probability of selecting ____?” Then we typed our answer choices: Certain, Likely, Unlikely, Impossible. To share the slideshow with our class, we clicked File > Publish to the web, and copied/pasted the link to Google classroom. When students viewed each others’ slideshows, they clicked the link on the polling page and answered the question. Finally, after everyone had voted, the students went back to their own slideshow and clicked Poll Everywhere > Insert > Screenshot to create a new slide with the results. You can see them all here.


3rd Grade Temperature Predictions & Comparisons

Third graders at Holladay Elementary have been learning about the motions of the Earth in Science (SOL3.8a) and temperature in Math (SOL3.13). Today we predicted, researched, and compared temperatures from around the world, and then discussed reasons why they were so different. I gave each student a copy of a blank Google slideshow, and showed them how to create the title slide, “Temperature.” I also showed them how to change the theme. Then we added a new slide and titled it “Richmond Weather.” Before looking up the current temperature, I asked them to predict the temperature based on what they saw and felt this morning. We used this interactive thermometer to show the temperature. I like how it displays the temperature in Fahrenheit and Celsius and provides a representative photo for different temperatures. We took a screenshot and added it to our slide. Then, we did a Google search for “Richmond weather” to find the current temperature and added the actual temperature to the slide. Many of the students’ predictions were very close. Next, we wanted to see what the weather was like in some other part of the world. The students could pick a city or country of their choice. Holladay has students from all over, so many of them picked their home countries–China, Vietnam, Mexico, El Salvador, and more. When they typed the name of their city/country and “weather” in a Google search, they found the current temperature and time. We talked about why the time and weather were different (because of the rotation and tilt of the Earth). They adjusted their interactive thermometer to display that temperature, took a screenshot, and pasted it to a new slide. We also added an image of the city/country to the slide (click the image button > Search). Finally we published our slideshows (File > Publish to the web), and pasted the link to Google classroom. You can see them all here.


5th Grade Plants Under the Proscope

Fifth graders at Trevvett Elementary have been learning about vascular and nonvascular plants in Science (SOL5.5). Today students in Ms. Ballou’s class examined different types of plants using a digital USB microscope called a Proscope. First, the students got into self-selected groups, and we distributed the Proscopes and the plants (flowers, moss, celery, and ferns). Then they logged into Google classroom where I posted a Google slides template for them to use to share their findings (you can make a copy of the template here) Students put their names on the first slide, and on the subsequent slides they were to identify each plant as vascular or non-vascualr and upload a photo or two of the plant under the microscope. Proscope makes it easy to take photos by simply clicking a button. Some students also labeled different parts of the plants using the text box and arrow tools. They had a great time seeing the plants in a way they had never seen them before, and they also got some practice making a Google slideshow. You can see their finished slideshows here. Let me know if you’d like to use the Proscopes with your class. Each school has a couple, and I can bring a box of 15 additional ones.


3rd Grade Create a Holiday Logo

Third graders at Trevvett Elementary have been learning about being a good citizen and celebrating national holidays, like Veterans Day (SOL3.11). Students in Ms. Robinson’s class created their own national holiday, and today she asked me to help them make a logo to represent their holiday. First we talked about logos. They are easily recognized symbols with simple designs and just a one or two colors. I showed them a few logos to see if they could recognize them (Apple, T-Mobile, Xbox, Android, Playstation, Olympics, McDonalds, Domino’s, etc). Some logos even have hidden symbols (like the arrow in FedEx, 31 in Baskin Robins, two people sharing a chip in Tostitos, the letter g/face in Goodwill, and the kiss in Hershey Kisses). I explained that the logos they create for their holiday needed to be simple and easily understood, but they could also have hidden messages or surprises. I gave them each a copy of a blank Google doc in Google classroom and showed them how to type the name of their holiday and change the font, size, and color. We discussed the importance of fonts in logos and realized that the most important thing was that it was easy to read. There are not many cursive fonts in logos (Coca-Cola is a famous exception). Next we went to LogoMakr to design our logo. This is a great site for any kind of illustration because there’s no login, it has a huge collection of clip art, you can customize the colors, and your art is quickly downloaded as a PNG file with a transparent background. After students created their logos, we imported them into our Google doc (Insert > Image > Upload from your computer) and wrote about the holiday. Finally we published our work to Google classroom. You can see all the holiday logos here.


4th Grade Jamestown Animated Timelines

Fourth graders at Holladay Elementary have been learning about Jamestown (VS.3), so today students in Ms. Anthony’s class created animated timelines about important events in Jamestown using Google slides. First I gave each student a copy of a blank Google slides template in Google classroom. I showed them how to add a background image of the James River (Background button > Image > Choose) and edit the title and subtitle on the first slide. On the second slide I showed them how to change the background color and use the line tool to create a timeline. We chose 3 important dates for our timeline and typed them in text boxes: 1600 Powhatan Indians live in Virginia, 1607 English arrive at Jamestown, and 1619 First representative government, House of Burgesses. Next we clicked the Image button and searched for pictures of each of these events. The students resized their pictures and moved them to the correct spots on the timeline. They also added animations to the events, making them appear in order. Finally we clicked File > Publish to the web and copied the link to share on Google classroom. You can see some of the students’ timelines here.


5th Grade Ocean Food Chain

Fifth graders at Varina Elementary have been reading and writing nonfiction text (SOL5.6 & 5.7) and they have been learning about ocean food chains in Science (SOL5.6). So today students in Ms. Primrose’s and Mr. Williams’ classes created an ocean food chain in Google drawing and wrote about it. First I gave them each a copy of a blank Google doc in Google classroom. I showed them how to add the title and change the font, size, and color. Next we had to research our food chain. The students could pick whichever sea creatures they were interested in, but they had to have the correct predator-prey relationships. For example, they couldn’t have a jellyfish eating an octopus. I explained how to open a new tab and ask Google questions like, “What is an ocean plant? What eats seaweed? What predators does a dolphin have?” Once they had their correct food chain facts, they wrote about the sequence in their Google doc. Then we clicked Insert > Drawing, and the students created their food chain diagram using images (click the Image button > Search) and arrows (click the Shapes button). Finally, we clicked File > Publish to the web, copied the link, and posted our projects to Google classroom. You can see them all here.