5th Grade Interactive Graphs
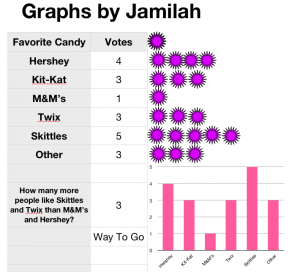
 Today 5th graders in Mr. Peters’ class created interactive graphs using Numbers. They started out with a template that you can download by clicking here. They picked a topic they were interested in graphing, such as favorite sport or favorite candy and wrote the title. Then they went to Shapes, created a shape, changed the color, and copied and pasted it about 20 times so there were enough counters for each student in the class. Next they went around the room and clicked and dragged the shapes on their classmates documents to vote on their favorite things. When they got back to their own document, they counted the markers for each choice and typed in the number. Then I showed them how to graph the data. For the interactive part, I told them to come up with a multiple step problem about the data that would challenge their peers. For example, one student came up with the question “How many more people like Skittles and Twix than M&Ms and Hersheys?” Next I taught them how to create a formula that would check the answer. It went something like this: “If the student response equals the real answer, then say ‘Way to go!’ Otherwise say, ‘You need to study more!'” They could come up with their own replies, and some were rather creative. Finally they tested their formulas by switching with a friend and solving each others’ problems. You can download a couple of student examples here: Amber and Jamilah.
