
3rd Grade World Weather
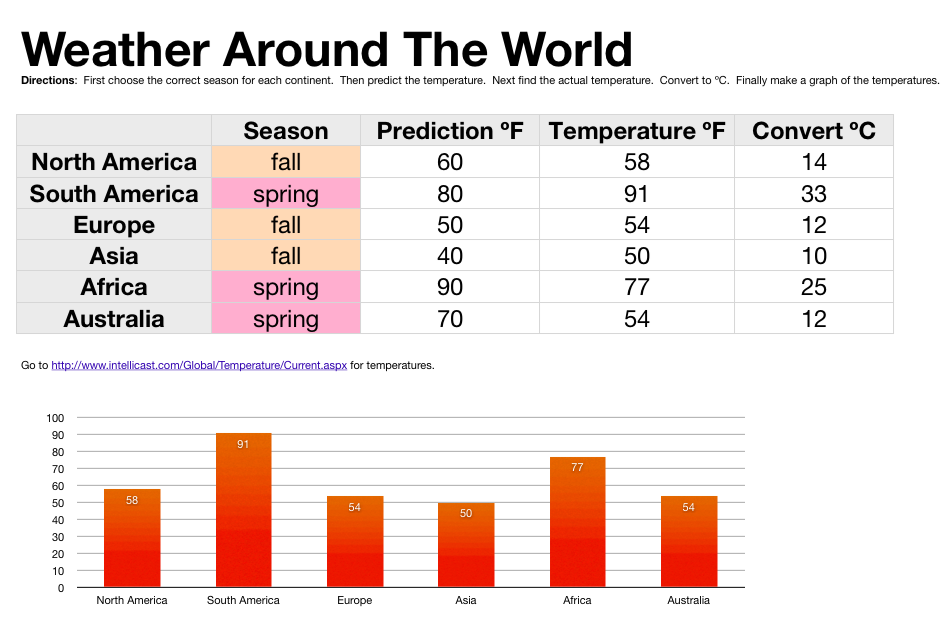 Third grade students in Ms. Strickler’s class at Varina Elementary have been studying the continents and hemispheres in social studies (SOL3.5) and temperature in math (SOL3.13) so today we looked at the relationship between hemispheres and temperatures. I gave them a Numbers template that you can download by clicking here. First, in Column B, the students tried to figure out which season each continent was having based on which hemisphere it was in (we discussed how seasons are opposite in the northern and southern hemispheres). Next they predicted the temperature for each place in Column C. To get today’s temperature from different spots around the globe we went to this website. In my research I also found this cool weather website, but it’s not as simple as the other one. The students entered that data into Column D. Since they were learning about Celsius and Fahrenheit I instructed them to create a new Column E and title it “Convert ºC.” You can make the degree symbol by holding down Option + 0 (zero). I showed them how to write a formula for converting from Fahrenheit to Celsius. Then they dragged the little white dot in the corner of the cell down through the other cells to copy the formula into them. The students were impressed with how quickly the temperatures were converted. Our last step was to create a graph of the temperatures so we could visualize quickly which continent was hottest, coldest, etc. I told the students to come up with some questions about their data for a friend to answer (like, “How much warmer is it in Africa than North America?”). Now that it’s complete, the students can open this spreadsheet during a different season, enter new temperatures, and the formulas and graphs would change according to the data.