
Animated 3-D Graphs
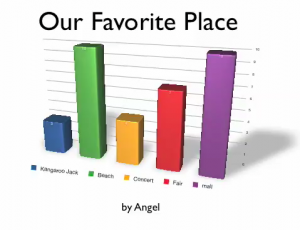 Fourth grade students at Laburnum had fun making animated 3-D graphs today using Numbers and Keynote. First they collected their data by asking each other a question, “What’s your favorite _____?” They used tally marks to keep track of the votes. Then they graphed the results using Numbers. I showed them how to use the Inspector to make the bars look like wood, metal, or marble. Next, they copied their graph over into Keynote and used the Build Inspector there to add a 3-D Grow Effect to their graph. The results were pretty impressive. Take a look at some of their favorite places, sports, restaurants, animals, ice cream flavors, family members, and foods.