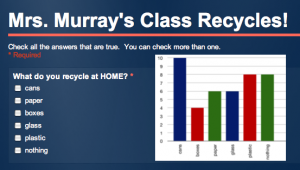
1st Grade Recycling Graph
 First graders in Ms. Murray’s class at Laburnum Elementary have been learning about recycling (SOL1.8). They have also been learning about graphing. So we wanted to see if they could collect some recycling data and make a graph about it (and even do a little bit of data analysis on a first grade level). I created a Google Form for them to collect their data. You can view the form by clicking here. They collected data about what they recycled at home and also wrote about things they reuse or try to reduce using at home. After everyone entered their information, I showed them the data set (you can see it here). We discovered that when the data is presented like that, it doesn’t make much sense. So I gave them a Numbers template for graphing the data. You can download it here. The students entered the information about what their classmates recycled and noticed some patterns right away! They were able to discuss ways they could improve their recycling habits at home. You could adapt this idea to almost any data collection and graphing lesson. Let me know how I can help!
