
4th Grade Virginia Tally Marks & Graphs
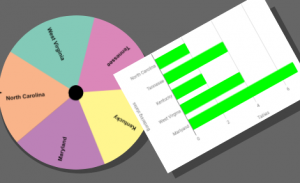 Fourth graders at Varina Elementary have been learning about Virginia geography (VS.2) and Jamestown (VS.3) in Social Studies, and they have been making bar graphs in Math (SOL4.14). Today students in Ms. Belcher’s class chose a Virginia topic, created a spinner out of its subtopics, tallied the spins, and graphed the results. First, we reviewed various topics they could use to generate their spinner subtopics: Virginia Rivers, Virginia Regions, Indian Language Groups, Problems at Jamestown, Bordering States, etc. Next, we created our custom spinners using a cool webtool called WheelDecide. Then they spun the spinner as many times as they could in two minutes and tallied the results on paper. To make the graph, we used a Google spreadsheet. I showed them how to access their Google shortcuts (the array of 9 tiny squares in the top right corner of a Google search page), and we opened a new spreadsheet. In the first column we typed the spinner subtopics, and in the second column we typed the number of tallies for each one. Then we highlighted the columns, pressed the graph button, and a bar graph appeared! I showed the students how to change the colors of the bars, if they wanted. We shared our spreadsheets on Schoology, but you can see them all here. Can you guess the main topics just by looking at the graphs?