Category: Social Studies

4th Grade Virginia Weather Graphs

VAGraph
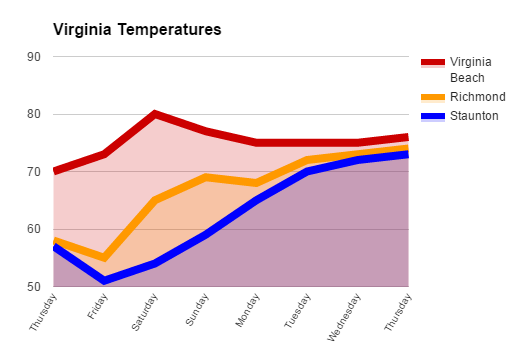
Fourth graders at Davis Elementary are learning about weather in science (SOL4.6), Virginia regions in social studies (VS.2b), and graphing in math (SOL4.14). So today students in Mr. Cochran’s class researched current temperatures in different regions of Virginia and graphed them. I gave them a template that you can copy here. First we clicked the “City” link and looked at the current temperatures in different Virginia cities. I showed them how they could click the column headings to sort by that category, so we sorted by temperature. We took a city from the highest temperatures (Virginia Beach), a city in the middle temperatures (Richmond), and a city in the low temperatures (Staunton). Then we located those cities on a map of Virginia and discussed why the temperatures might be different. The students noticed that the colder cities were further west (higher altitude) and north (higher latitude). Next we looked at the weekly forecast for the three cities (linked on the spreadsheet). Your students could choose their own cities to graph, but we just graphed the temperatures for the three cities we researched to save time. On the spreadsheet I showed them how they could click the “Thursday” cell and drag the small blue square handle down through seven more cells to have them fill in with the days of the week. Then they filled in the rest of the cells with the temperatures. Next we clicked the graph button and chose a line graph. I showed them how to customize the color and thickness of the lines, and we added a title. They posted their graphs to Google classroom, but you can take a look at some here.


4th Grade Primary Sources

JuxtaFourth graders at Davis Elementary are learning about primary and secondary sources (VS.1a), so today students in Ms. White’s and Ms. Bennett’s classes collected and analysed their own primary sources. First we discussed primary sources and why they are valuable. We looked at some Civil War photos, some photos of Abraham Lincoln, and a contemporary painting of George Washington. The students correctly identified all of these as primary sources. I explained that they would be going back in time today to take a photograph of a place, and then we would be comparing that old photo with a modern one. First we opened up Google Earth, and I told them to find a place in which they were interested. We discussed examples like their neighborhood, a favorite vacation spot, or a place that was important to their family. We zoomed in fairly close, so we were able to see roads and buildings. Next I showed them how to use the timeline feature and we went back in time. I asked if this was a primary or secondary source. We figured out that it was a primary source because it was a photograph taken by a satellite at that time. We used the Snipping Tool to take a screenshot of the place and saved it to our desktop. Then we dragged the timeline to the present and took another screenshot. We combined the two images using a cool webtool called Juxtapose. The images have to be hosted online to get the links, so we uploaded them to Comemories. Then we copied the links and pasted them in Juxtapose. Juxtapose turns them into a before/after comparison complete with a slider. The students could now compare the images and see how the places changed over time. Take a look at some student examples here.


4th Grade Famous Virginians Come to Life!

Screen Shot 2015-08-12 at 11.04.38 PMFourth graders at Davis Elementary have been learning about famous Virginians in the 20th century (VS.9d), so today we brought them to life with the magic of technology! First the students decided whether they wanted to work in groups or alone. This project, like any project that uses an online tool, goes a lot smoother if students are working in groups since less computers are using the bandwidth. Once they selected their group, they chose a famous Virginian and found an image of the person online. I explained that they needed a good clear photo of the person’s face looking straight ahead. Next we downloaded a screen recording Chrome extension called Screencastify. We would need this tool in the last step to record our videos. Now we were ready to go to SitePal where the real magic happens. We clicked “Create Your Own” talking avatar and uploaded the image of our famous Virginian. The site guides you through the process of animating the head. Then the students wrote a paragraph in the Text-to-Speech section with facts for the “talking head” to say. They also chose a voice. We used Screencastify to record the videos since there isn’t another way to save them. Finally they posted their videos to Google classroom so they could watch each others’. You can watch them too by clicking here.


4th Grade Review Videos

Screen Shot 2015-08-12 at 3.26.13 PMFourth graders at Davis Elementary have been reviewing for upcoming end-of-the-year tests, so today students in Ms. White’s class helped each other by preparing review videos on various topics. First the they decided whether they wanted to work in groups or alone. This project actually works better if most of the students are in groups since it is bandwidth intensive. Once they were with their groups, they agreed on a topic and did some quick research using the Internet and their class notes. They also collected images to use in their video. Next we went to WeVideo, which is a great site for making and editing online videos. The students signed in with their Google accounts and opened the movie editor. We used the storyboard mode, instead of the timeline mode, since it was simpler for their first video (click the 3 lines in the top left corner to switch from one mode to the other). They uploaded the images they collected and recorded a few clips of themselves explaining the topic. Then they organized their media in the editor, added a Title screen and captions, and selected a theme. Themes make it easy to add filters, transitions, and music automatically, but each of those effects can also be changed individually. Finally the students published their videos, copied the links, and posted them to Google classroom so they could watch each others’ movies for review. You can see some of them here.


3rd Grade Economics Popplets

Screen Shot 2015-08-12 at 12.09.45 PMThird graders at Holladay Elementary have been learning about natural resources, capital resources, and human resources in economics (SOL3.7). Their benchmark tests also revealed that they need additional practice identifying the main idea and details in what they read (SOL3.5,3.6). Making a diagram is a great way to clarify main idea and details, so today students in Ms. Middleton’s class created business diagrams using Popplet. First the students decided what kind of business they wanted to have, and they created a bubble with the name of their business. I showed them how to change the color of the bubble and draw a picture. Then we added three bubbles connected to that bubble (click the little dots around the bubble to add connecting bubbles). We labeled them natural resources, capital resources, and human resources. We also drew a picture for each one and made the bubbles different colors. I explained that if we were going to write a paragraph about our business, those would be the main ideas for three paragraphs. Now we would add the details. Students added connecting bubbles to each type of resource with items from their business that pertained to that category. When they were finished, they downloaded their images and posted them to Google classroom so they could see each others’ work. You can take a look at some of them here.


4th Grade Famous People Predictions

Screen Shot 2015-08-12 at 10.29.39 AMFourth graders have been studying famous Virginians of the 20th century in social studies (VS.9). Making predictions (SOL4.5i) was also an area of weakness on the benchmark tests, so today students in Ms. Anthony’s class created websites where they asked their classmates to predict how a famous Virginian would react in a certain situation based on their character. First each student picked a famous Virginian and did some quick research about him or her using the Internet or their notes. Next we went to CheckThis, and I showed them how to customize the theme, fonts, and colors of their website. They uploaded a photo of their person and typed a few facts, focusing on ones that revealed the person’s character. Then they thought of a new situation for the person and wrote it as a poll question. They also wrote some ways the person might react to the situation for their classmates to choose from and practice making predictions. Finally they posted their websites to Google classroom so their classmates could visit them and vote. You can take a look at a few samples here, and you are welcome to vote as well.


4th Grade Battlefield Fractions

Screen Shot 2015-08-06 at 4.04.19 PMFourth graders at Davis Elementary have been learning about the Revolutionary War and Civil War battles fought in Virginia (VS.5c & VS.7b). They have also been learning how to compare fractions (Math SOL4.2a). So today students in Ms. White’s class compared the fractions of casualties in each battle to determine which battle was Virginia’s greatest victory. First students chose a battle they wanted to research. We used Wikipedia to quickly find the number of casualties on both sides. Next we went to Piktochart to create an infographic to display our findings. I showed them how to choose a template, add a title, and change the font, size, and color. Next we added a map of the United States (under Tools). They had to erase the data that was already in the map and replace it with the battle casualties data. Then they changed the colors for Virginia and the rest of the map. After that we added a pie chart showing the casualties (students had to type the data again and change the colors). I pointed out that they should try to limit the colors in their infographics to three or four colors. Last, they added some icons (under Graphics) to decorate their infographics. Finally we posted our infographics to our Google classroom page, and our classmates estimated and compared the fractions shown in the pie charts using the comments section under each infographic. After analyzing the fractions, we determined Virginia’s greatest victory. Which battle do you think it was? Take a look at some samples here. If you would like additional information about this lesson, including the lesson plan, you can find it on our county’s Henrico21 website. UPDATE: I taught a similar lesson in Ms. Burcham’s class at Varina, and you can see their infographics here.


3rd Grade Educational Coins

Screen Shot 2015-08-06 at 11.50.28 AMThird graders at Varina have been learning about money and multiplication in math (SOL3.8 & 3.2), so today students in Ms. Leo’s class designed their own educational coins and made up multiplication problems about them for their classmates to solve. First we discussed how the U.S. Mint designs new coins to sell and how, if people don’t like the designs, they won’t buy them. There are thousands of unused dollar coins sitting in vaults because no one wants them. I asked the students to guess the most popular coin (surprisingly, it’s the penny). Since they were also learning about the water cycle in science (SOL3.9), I told them to put something educational on their coins from science (water cycle, plant cycle, frog cycle, butterfly cycle, related to the circle shape of coin) or social studies (Greece, Rome, famous Americans, etc). They could either work with a partner or by themselves. Partners divided up the tasks, so one designed the coin using Pixie and the other designed a website about the coin using CheckThis. The website had to persuade people to buy the coin. Then they made a math multiplication word problems to explain how the coins are packaged and shipped out to banks (rolls of coins in boxes). Their sites were published to the classroom page, but you can take a look at them here.


End the Mapathy at EdTech 2015

Screen Shot 2015-08-06 at 10.31.01 AMToday I presented at the EdTech 2015 conference at Virginia Commonwealth University (VCU) in Richmond. My presentation was called “End the Mapathy,” and it was all about the amazing things you can do with maps. First I focused on Google Maps. I showed how you can create your own maps which are automatically saved to your Google Drive with My Maps. Street view is now more powerful than ever with the ability to explore not only streets, but inside museums and other buildings, around famous landmarks, and even under the ocean. In Google Maps try dragging the yellow pegman to a site you are curious about and look for small colored dots to appear. If you drop pegman on any of those colored dots you can get a 360º view around that place. Explore some of the best street view spots with Google Treks. There are also several webtools that work with Google Maps like Animaps (create animated maps like this) and overlays (put historical maps on top of Google maps and adjust the transparency like this or this or this). Next, I shared some of the cool things you can do with Google Earth like creating tours of cities, the ocean, the moon, and even Mars. A new webtool to simplify the process is Google Tour Builder. Here’s a sample tour of Greece & Rome. I shared over 60 other map resources which you can find on my End the Mapathy website.


4th Grade Facts & Opinions About Famous People

Screen Shot 2015-08-05 at 10.24.53 AMFourth graders at Holladay Elementary have been studying famous Americans from the pre-Civil War time period (VS.7), and their benchmark tests revealed that many of them needed help distinguishing between facts and opinions (SOL4.6h). This is a very important skill, since most propaganda and persuasive articles are a mixture of both facts and opinions. So today we created websites about the famous Americans that included facts and opinions, and our classmates had to decide how we were trying to persuade people to feel about the person. First I asked them to choose a famous American from the pre-Civil War era (John Brown, Harriet Tubman, Abraham Lincoln, or Nat Turner). Next we signed into CheckThis with our Google accounts. I showed them how to change the theme, colors, and fonts of the webpage. They researched their famous person online to gather some facts. Then they wrote a paragraph about him or her and added some opinions of their own. Next they added a photo of the person. Finally, each student wrote a poll question at the bottom of their site, asking their classmates to identify how they were trying to persuade their readers to feel about the famous American. You can take a look at some of their websites here.