Tag: GoogleMaps

4th Grade Virginia Products & Industries Maps

Map
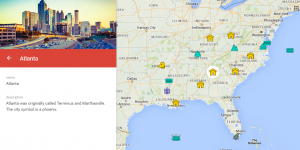
Fourth graders at Laburnum Elementary have been learning about Virginia products and industries (VS.10b), so today students in Ms. Butler’s class created interactive Virginia product maps. First I posted a link on Google classroom to my Google Maps and a map layer (KML file) showing the different regions of Virginia (you can download it here). One of the nice things about creating Google maps is that you can upload map layers that other people have created, which saves a lot of time. Students accessed My Google Maps, then clicked “Add A Layer,” and they uploaded the KML file that they had downloaded. Next I showed them how to add markers to the different regions where they wanted to show a product or industry. I also demonstrated how to add a custom icon (click the paint bucket > More icons > Custom icon), and explained that transparent PNG files would look best since they don’t have a background. Students continued adding product icons to their maps with descriptions of each. When they finished, we shared our maps to “Anyone with the link” and posted the links to Google classroom. You can see them all here.


2nd Grade American Indian Maps

CaptureSecond graders at Laburnum Elementary have been studying the American Indians (SOL2.2) and map skills (SOL2.4), so today students in Ms. Satterfield’s class created American Indian maps. I posted a link to My Google Maps on Google classroom and pointed out that students can always get back to any maps they create by using that link. On the website, we clicked the red “Create new map” button and titled it “Indian Map.” I explained that they would watch me make a marker first, then we would make one together, and finally, they would create some by themselves. First I made a sample marker on Laburnum Elementary to show them how to add a marker, change the color and style of the marker, and add text and images. Next each student clicked the marker button on their own map and placed a marker where the Powhatan Indians lived in Virginia. We titled it “Eastern Woodlands” and wrote a complete sentence about the Powhatan Indians. After pressing the blue “Save” button, we clicked the camera button to add a photo. Since typing the name of the tribe didn’t usually provide good results, I suggested that they could search for the environment (woodlands), homes (long houses), animals (deer), modes of transportation (canoe), etc. Then I showed them how to customize the marker icon using the paint bucket button. Now it was up to them to create markers showing where the Lakota and Pueblo Indians lived. I wrote a word bank on the board for them to use (Great Plains, Southwest Desert, buffalo, bison, teepees, tipis, adobe, multi-story terraced buildings, etc). When the students were finished with their maps, we clicked the “Share” button and changed the privacy to “Anyone with the link.” We copied the link to our map and posted it on Google classroom for our classmates to see. You can see them here.


4th Grade Civil War Marching Maps

CaptureFourth graders at Holladay Elementary have been learning about the Civil War in Social Studies (VS.7) and measurement in math (SOL4.7) so today we created Civil War Marching Maps using My Google Maps. First the students chose two major Civil War battles to mark on the map (Bull Run, Fredericksburg, Richmond, Appomattox, or Hampton Roads). Then they added an image and some brief factual information about the battle to each marker. Next we clicked on a marker and chose the directions icon at the bottom of the popup window (it looks like an arrow). That added a new layer to the map legend on the left with the location marked as “B”. We added the name of the other marker in the “A” box, and clicked the three dots to choose “Step-by-step directions.” That gave us the distance in miles. However, the time wasn’t accurate because it was based on driving, whereas the Civil War soldiers marched. So we clicked the car icon and changed the Transportation mode to walking. Now students had an estimate of how long it would take for the soldiers to march from one battle to another. Yet that still was not accurate because soldiers didn’t march nonstop. They averaged 15-30 miles per day, so students could divide the distance by 20 or 25 to figure out how many days it would take for Civil War soldiers to march that distance. Students shared their maps on Google classroom, and you can see them all here.


4th Grade Revolutionary War Maps

CaptureFourth graders at Davis Elementary have been learning about the Revolutionary War (VS.5), so today students in Ms. White’s class created Revolutionary War maps using My Google Maps. First I posted a link to My Google Maps on Google Classroom. With My Google Maps, anyone with a Google account can create their own customized maps. I showed the students how to add a title and change the way the base map looks (click the arrow next to “Base Map”). Next we added markers to the places where important events and battles occurred. The students wrote a description of each event and added a photo (click the camera button). Then I showed them how to customize the marker icon with an image (click the paint bucket, click “Custom Icon,” and do a Google image search). Finally, we clicked the “Share” button, changed the settings so that the map could be seen by anyone with the link, and copied and pasted the link to Google classroom. You can see all the students’ maps here.


2nd Grade U.S. Geography Maps

CaptureSecond graders at Davis Elementary are learning about map skills and United States geography (SOL2.5). Today students in Ms. McGovern’s class created their own customized Google maps showing the important features like the Great Lakes, the Mississippi River, and the Rocky Mountains. First I posted a link to My Google Maps on Google classroom. The students clicked “Create a new map” and titled it “United States.” Then I showed them how to add markers and customize the color and shape of the markers using the paint button. They placed markers on a few places and labeled them. I also showed them how to click the camera button to add photos of each place. They used Google image searches to find pictures they liked. Next I showed them how to use the line tool to draw the rivers (Mississippi and Rio Grande), and they customized the color and width of the lines. Finally, we shared our maps to anyone with the link and posted them to Google classroom. You can see them all here.


5th Grade Southeast Region Maps

CaptureFifth graders at Davis Elementary have been learning about the southeast region of the United States, so today, students in Ms. Bailey’s class created interactive maps of the southeast region. First I posted a link to My Google Maps on Google classroom. My Google maps allows you to create and save your own maps. The students had to identify places of importance or interest in each state and place a marker on those spots. I showed them how to customize the markers and how to add text and photos to each one. Next the students clicked the Share button and changed the setting from “Private” to “Anyone with the link can view.” We copied the links and posted them to Google classroom so they could see each others’ maps. You can take a look at them here.


End the Mapathy at EdTech 2015

Screen Shot 2015-08-06 at 10.31.01 AMToday I presented at the EdTech 2015 conference at Virginia Commonwealth University (VCU) in Richmond. My presentation was called “End the Mapathy,” and it was all about the amazing things you can do with maps. First I focused on Google Maps. I showed how you can create your own maps which are automatically saved to your Google Drive with My Maps. Street view is now more powerful than ever with the ability to explore not only streets, but inside museums and other buildings, around famous landmarks, and even under the ocean. In Google Maps try dragging the yellow pegman to a site you are curious about and look for small colored dots to appear. If you drop pegman on any of those colored dots you can get a 360ยบ view around that place. Explore some of the best street view spots with Google Treks. There are also several webtools that work with Google Maps like Animaps (create animated maps like this) and overlays (put historical maps on top of Google maps and adjust the transparency like this or this or this). Next, I shared some of the cool things you can do with Google Earth like creating tours of cities, the ocean, the moon, and even Mars. A new webtool to simplify the process is Google Tour Builder. Here’s a sample tour of Greece & Rome. I shared over 60 other map resources which you can find on my End the Mapathy website.


3rd Grade Precipitation Probability Maps

Screen Shot 2015-08-04 at 4.49.55 PMThird graders at Holladay Elementary have been learning about the water cycle in science (SOL3.9) and probability in math (SOL3.18), so today Ms. Cowart’s students created precipitation probability maps. First we reviewed how probability relates to weather forecasting, and after so many snow days in February, the students were expert weathermen! We discussed the terms “likely”, “unlikely”, “certain,” and “impossible.” Next I posted a link to Google Maps on their Google classroom page and instructed them to click the “Create a New Map” button. They chose a type of precipitation/storm they had learned about (thunderstorm, snow, tornado, hurricane) and added an icon of it to their map. Then I showed them how to type a sentence and add a picture to it. They also added colored lines showing the probable paths of the storm. Finally they published their maps and posted the links to Google classroom. Their classmates added comments identifying the probability of the storm hitting Virginia. You can take a look at some of the maps and see the comments here.


5th Grade Northeast Region Thinglinks

Screen Shot 2015-08-03 at 11.16.05 AMFifth graders at Davis Elementary have been learning about the northeast region of the United States (NE1.2, NE2.2), and they have been learning how to write to inform (SOL5.7). So today, students in Ms. Bailey’s class created interactive Thinglink maps highlighting some of the interesting places in each state. First we needed to get a map of the northeast region. I gave them a link to Google maps and showed them how to choose either the standard view or a satellite image (click the box in the bottom left corner). Once they had the map centered on the northeast region, I showed them how to take a screenshot using the Snipping Tool. Then we went to Thinglink and logged in with our Google accounts. The students uploaded their map and added hotspots to different cities in the northeast region that they had been researching. For each hotspot, I taught them how to customize the icon, upload an image, and write an informative paragraph about the place of interest. We only had time to do one or two places, but Ms. Bailey continued the project with her class, and they were able to add several more on their own. You can see their final projects here.


4th Grade Multiplication Maps

Screen Shot 2015-05-14 at 11.51.39 AMFourth graders at Holladay Elementary have been learning about life in colonial Virginia and the Revolutionary War (VS.4,VS.5), and they’ve been learning how to multiply two digit numbers in math (SOL4.4), so today we made multiplication maps about colonial Virginia in Ms. Ficor’s class. First we discussed which major cities existed during this time (Norfolk, Richmond, Williamsburg, Yorktown). We also talked about what activities would require colonial people to travel from town to town (trading, spying, fighting, visiting). I explained that they would be creating maps with a story problem to solve. They would have to figure out the distance between two towns, tell why a colonist was traveling back and forth between those towns, and tell how many times that person made the trip. Then their classmates would solve each others’ problems. I posted a link to My Google Maps on their Google classroom page. The students placed markers on the two towns their colonists were traveling between and then clicked for directions. A blue line is automatically created with the distance. I showed how they could change the mode of transportation to walking. Next they shared their maps and copied the link to post to the classroom page. They wrote their story problem in their post, and their classmates solved them in the comments. I pointed out that they needed to solve their own problems, so they could check the answers. You can try out some of their problems here.