
4th Grade Mapping the Hurricanes
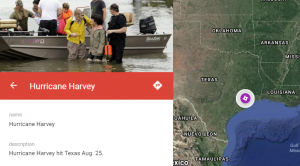 Fourth graders at Holladay Elementary have been learning about weather in Science (SOL4.6) and maps in Social Studies (SOL4.1), so today students in Mr. Rivara’s class created Google maps showing this season’s hurricanes. The 2017 hurricane season has been rough, with Hurricane Harvey hitting Texas at the end of August, and Hurricane Irma currently hitting Florida! First I showed them a few webtools that are great for tracking hurricanes: Earth and Meteoearth both show wind directions across a 3-D globe, while Windy shows wind directions on a flat map. Next, we went to My Google Maps and created a new map. I showed them how to add a marker to show where Hurricane Harvey hit in Texas. We added a title and a descriptive sentence with a fact about the hurricane. The students had to do some quick research to get their fact by opening a new tab and typing “Hurricane Harvey” in the search box. I wanted them to find a fact with a number, since they are learning about place value in Math (SOL4.1a). Finally, we added a photo of the hurricane, and I explained how to customize the marker by changing the color and icon. We had time to add one more marker for Hurricane Irma. They will continue using the map to track other hurricanes this season. You can see all their maps here.