
4th Grade Animated Graphs
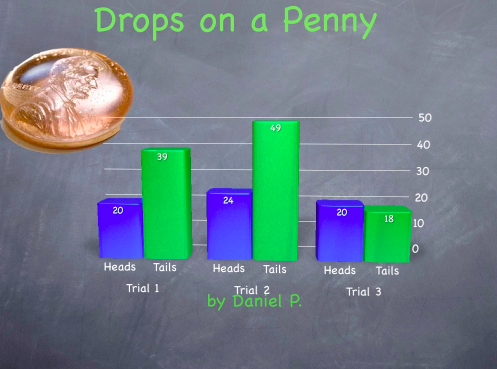 Fourth graders in Ms. White’s class at Davis Elementary recently did an experiment where they predicted which side of a coin could hold more drops of water. Then they tested their hypothesis by counting the drops they placed on each side of a penny for several trials. Today my job was to show them how to create an animated graph of their data using Keynote. First I showed them how to choose a theme in Keynote and add a picture of a penny that they downloaded off the Internet. Next we clicked the Charts button and added a 3-D bar graph. I showed them how to use the Inspector to edit the data, the labels, and the colors of the graph. Then we used the Build Inspector to add a 3-D Grow build to the graph. We also animated the title, picture, and our names. Finally I showed them how to use the Document Inspector to record their voiceover (the Record button can be found in the the Audio tab). Their animated graphs turned out great. Take a look at Kate’s and Paige’s.