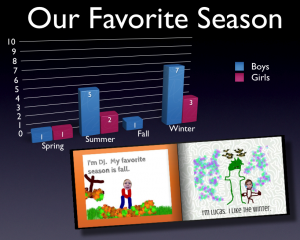
1st Grade Seasons Book & Graph
 Today 1st grade students at Holladay Elementary did a multi-step technology lesson and they finished in just an hour! First they had to draw a picture of themselves in their favorite season using Pixie. We saved the pictures as JPG images and uploaded them to Keepsy. In Keepsy, students could add sentences with different fonts and change the background color. All the pictures together make a book that you can view online here. The next step in the project was to count all the students who liked each season. We tallied the results and graphed them using a template in Keynote that you can download here. Once the data is entered (directions are included in the template), the graph is automatically generated, and if you press the play button you will see some cool 3-D animation effects.
