
5th Grade Decibel Day
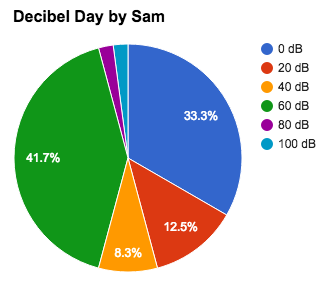 Fifth graders at Holladay Elementary have been learning about sound in science (SOL5.2) and fractions in math (SOL5.2), so today students in Ms. DiMatteo’s class figured out the fractions of their day spent at different decibel levels. First we discussed what decibels measure (they are a way to measure the loudness or amplitude of the sound waves). Next we researched decibels using a variety of websites: Bouncy Balls, Dangerous Decibels, and the Interactive Sound Ruler. That last website has a valuable scale giving examples of sounds at different decibel levels. We used it to calculate the percentage of our day we spend at each level. I posted a Google spreadsheet template on Google classroom for the students to use. I made some changes to the template after teaching this lesson to simplify things. You can make a copy of the template here. It has some samples for you to look at in the tabs (sheets) at the bottom. Once we figured out how many hours we spend at each decibel level, we wrote a formula to convert it into a percentage. This is where we used fractions because the formula was a fraction with a variable in the numerator (# of hours)/24 hours. Next we highlighted all the percentages and created a pie chart. When the students posted their spreadsheets to Google classroom they estimated the fraction of their day spent at a certain level. You can take a look at some examples here.