2nd Grade Weather Graphs
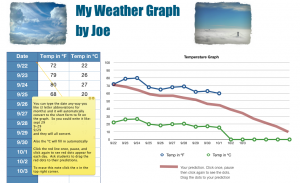
 Another 2nd grade class at Laburnum made weather graphs. They are going to keep track of the weather throughout the month and graph the temperatures. I gave them a template to use and showed them how to get started on it. You can download the template here. The template will automatically convert the Fahrenheit temperature to Celsius (so upper grades can use this template as well). It also has a prediction line that the students can click and drag to make their predictions. Take a look at a sample graph by clicking here. After students finish entering their data, they analyze it, look for patterns, and compare it to their predictions.
