Tag: numbers

4th Grade Probability Spinners

probability
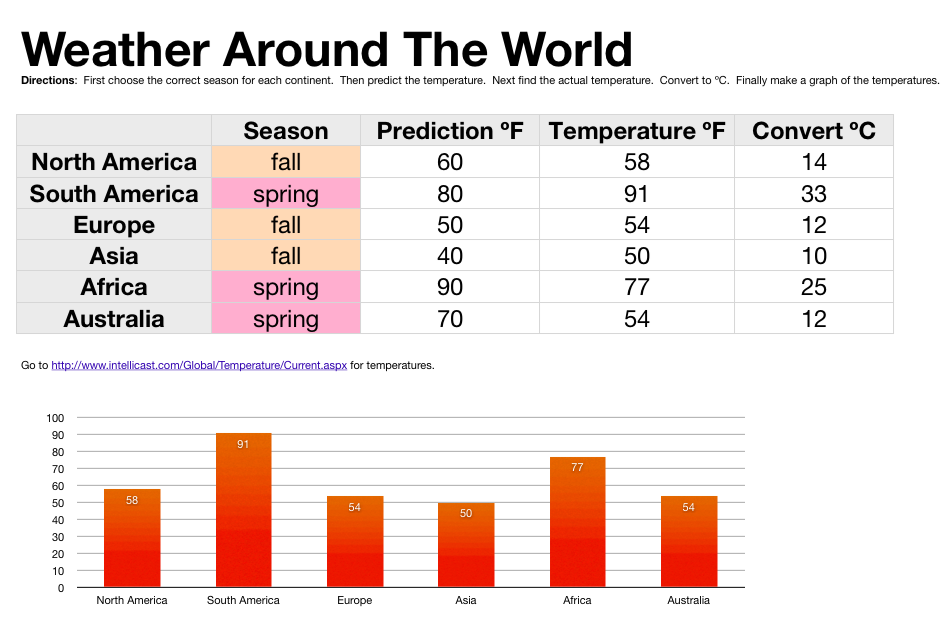
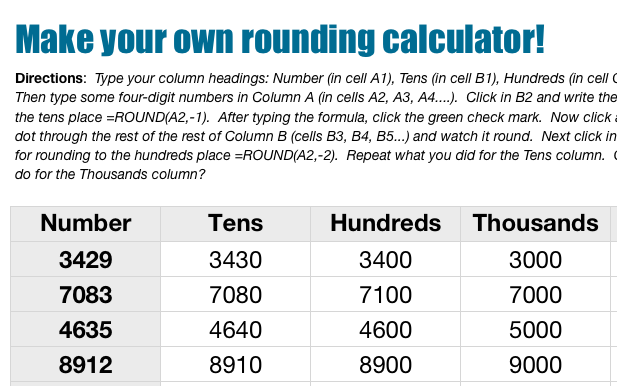
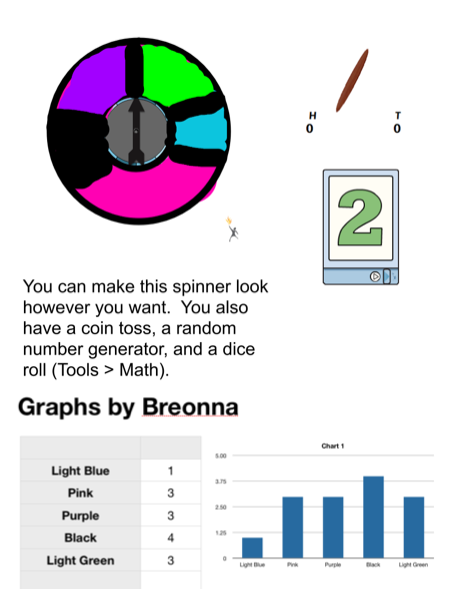
Ms. Thomas’s 4th graders at Varina Elementary have been learning about probability and predicting the outcome of events (SOL4.13) so today we created digital spinners to test our predictions. A gave them a Promethean flipchart that you can download by clicking here. It has a pre-made spinner, a coin toss, and a random number generator. I showed the students how they could use the paint tools to make the spinner have different sections of different colors. If they made the sections different sizes, we discussed how that would affect their predictions of the spinner’s outcomes. Next we opened a Numbers template (found in the same download link above) so they could record the results of their spins. The spreadsheet automatically generates a graph based on the data, but you could delete that if you want your students to create the graph themselves. Your students could also add a text box telling about their predictions and whether they were right or wrong. If you’d like to see a student example, click the image to see it larger (Breonna’s original files are also included in the download).


2nd Grade Coin Graph & Calculator

moneySecond graders in Ms. Vest’s class at Davis Elementary have been learning how to count coins and bills up to $2.00 (SOL2.10). But when it comes to money, most kids want to count to the billions and higher! So why not? They can if they create their own calculator based on what they know, which is the value of each coin and bill. I gave them a Numbers template that you can download by clicking here. It has the coins and bills listed in the first column, and the students have to write formulas for calculating the total value based on the number of coins and bills that are entered into the 2nd column. I guided them through the first couple of formulas. For example, the formula to find the value of pennies would be: (NUMBER IN 2ND COLUMN * .01). They caught on pretty quickly and were able to write the rest of the formulas on their own. The template has a built-in graph, but with this class I had them create the graph themselves. You could do that as well by just deleting the pre-made graph. That way, they get practice with not only money, but graphing as well!


3rd Grade 3-D Shapes

mackenzieThird graders in Ms. Leo’s class at Varina Elementary have been learning about solid shapes (SOL3.14). They had to be able to identify the number of angles, edges, vertices, and faces of each shape. Today I showed them how to create a program that would identify the shape based on its features. We started out, like most programmers do, by making a flowchart. I thought about using Gliffy because there is no sign in required to create one (although you can’t save it), and it has the ability to type on the connectors, so we could have typed “yes” or “no” like this example. However, I decided to go with Popplet since it was much easier to use and you can draw pictures in the shapes. Since we couldn’t write on the connectors like with Gliffy, we worked around it by making the shapes green for “yes” and red for “no”. Their flowchart was basically a decision tree for identifying the shape based on its faces (so it was limited to the cube, rectangular prism, and square pyramid). They created their flowchart, drew pictures of the 3-D shapes, and then took a screenshot. You can see a couple of student examples here: Lauryn and McKenzie. Next I showed them how a spreadsheet and a formula can be used to identify the shape in a similar way. You can download the Numbers spreadsheet I used by clicking here. After looking at the example, I wanted them to write a simple formula on their own for distinguishing a cone and a cylinder. They had to come up with one good “yes” or “no” question and then write the formula (which was something like this: “IF ANSWER=”YES” THEN “CONE,” IF NOT, THEN “CYLINDER”). There is a sample included with the template, if you download it, so you can see how it works.


3rd Grade Create-Your-Own Calculator

Screen shot 2014-03-21 at 11.09.28 AMThe Mac spreadsheet program, Numbers, is most often used by students to make graphs, but it’s also a great program to teach students how to create formulas to solve problems. As students troubleshoot their formulas, they gain a better understanding of the underlying math concepts and practice logical thinking. Third graders in Ms. Middleton’s class at Holladay have been learning about multiplication and division (SOL3.5) so today I showed them how to create their own calculators with Numbers. First I gave them a template that you can download by clicking here. I told them that these calculators were going to be a little different. Instead of giving the right answer, they would let you know if your answer is correct. So we made two columns for the factors or divisors and a column for people to write their answers. In the fourth column we wrote our formulas. I showed them how to write the first formula for checking multiplication and I let them write the division formulas on their own. Spreadsheet formulas are also helpful for reviewing map grids (SOL3.5e) since they use the same basic principle of identification. You can see all the formulas in the sample that comes with the template, but here’s the multiplication formula: =IF(D2=B2*C2,”Right!”,”Wrong!”). It checks if the answer in cell D2 equals the product of the numbers in B2 and C2, and let’s the user know if they are correct. The students wrote their own feedback messages (and some were rather creative 🙂 After writing the formulas, students switched seats and tested each others’ calculators. Similar formulas can be written for almost every mathematical concept you teach. Go ahead and try it with your class!


Tags:


5th Grade Interactive Graphs

Screen shot 2014-03-17 at 2.48.04 PMToday 5th graders in Mr. Peters’ class created interactive graphs using Numbers. They started out with a template that you can download by clicking here. They picked a topic they were interested in graphing, such as favorite sport or favorite candy and wrote the title. Then they went to Shapes, created a shape, changed the color, and copied and pasted it about 20 times so there were enough counters for each student in the class. Next they went around the room and clicked and dragged the shapes on their classmates documents to vote on their favorite things. When they got back to their own document, they counted the markers for each choice and typed in the number. Then I showed them how to graph the data. For the interactive part, I told them to come up with a multiple step problem about the data that would challenge their peers. For example, one student came up with the question “How many more people like Skittles and Twix than M&Ms and Hersheys?” Next I taught them how to create a formula that would check the answer. It went something like this: “If the student response equals the real answer, then say ‘Way to go!’ Otherwise say, ‘You need to study more!'” They could come up with their own replies, and some were rather creative. Finally they tested their formulas by switching with a friend and solving each others’ problems. You can download a couple of student examples here: Amber and Jamilah.


3rd Grade Ancient Greece Math

greecemathThird graders in Ms. Leo’s class at Varina Elementary have just started learning about ancient Greece (SOL3.4) so I wanted to take them on a tour of Greece using Google Earth. I created a .kmz file with placemarks on important sites like Olympia, where the first Olympics were held (you can still see the track they ran on), the Parthenon (if you turn on 3-D Buildings you will see it), and Mount Olympus (the highest mountain in Greece where they believed the gods lived). But since my focus this year is on math and writing, I had them to measure the distances between the sites using the ruler tool and write some word problems about those distances. I created a Numbers spreadsheet with a lot of the information pre-loaded, that you can download by clicking here. First the students entered the distances into the spreadsheet. Then they came up with questions about the distances. We talked about clue words for addition (“all together” or “in all”) and subtraction (“how much further” or “how many more”). They made up word problems about Greek characters traveling to the different places and gave reasons why they would visit each place (in order to review what was there). Next they rounded the numbers and got an estimate. Finally they solved each other’s problems, and I had a formula that would check if they were correct when they clicked the red “Check” box.


3rd Grade World Weather

sampleThird grade students in Ms. Strickler’s class at Varina Elementary have been studying the continents and hemispheres in social studies (SOL3.5) and temperature in math (SOL3.13) so today we looked at the relationship between hemispheres and temperatures. I gave them a Numbers template that you can download by clicking here. First, in Column B, the students tried to figure out which season each continent was having based on which hemisphere it was in (we discussed how seasons are opposite in the northern and southern hemispheres). Next they predicted the temperature for each place in Column C. To get today’s temperature from different spots around the globe we went to this website. In my research I also found this cool weather website, but it’s not as simple as the other one. The students entered that data into Column D. Since they were learning about Celsius and Fahrenheit I instructed them to create a new Column E and title it “Convert ºC.” You can make the degree symbol by holding down Option + 0 (zero). I showed them how to write a formula for converting from Fahrenheit to Celsius. Then they dragged the little white dot in the corner of the cell down through the other cells to copy the formula into them. The students were impressed with how quickly the temperatures were converted. Our last step was to create a graph of the temperatures so we could visualize quickly which continent was hottest, coldest, etc. I told the students to come up with some questions about their data for a friend to answer (like, “How much warmer is it in Africa than North America?”). Now that it’s complete, the students can open this spreadsheet during a different season, enter new temperatures, and the formulas and graphs would change according to the data.


5th Grade 3-D Ocean Model

Screen shot 2013-12-08 at 3.36.44 PMFifth graders in Ms. Payne’s class at Laburnum Elementary have been studying the ocean (SOL5.6), and she wanted me to help them review the different parts of the ocean floor. One of my goals this year is to help our students improve in math, so I’ve been trying to incorporate math into as many of my lessons as possible. I figured we could use the 3-D area graph in Numbers to create a model of the ocean and then import it into Keynote to animate it like this example. I wanted the students to gather their own data, but just graphing that wouldn’t produce a good looking model. So I created a template that you can download by clicking here that takes the data they enter and turns it into a model of the ocean floor. The students used Google Earth to gather the data for the graph. First I told them to find a continental shelf and measure the depth. Google Earth automatically tells the ocean depth or land elevation for whatever spot your mouse is hovering over… just be sure it’s in meters and not feet or my formulas won’t work (you could add a bit more math by having them convert the units). Next the students find a continental slope, continental rise, abyssal plain, and sea mount to measure. After entering all that data, I told them to do some research online to find the depth of the Mariana Trench. I gathered a bunch of sites for oceans research into a BundleNut that they could use, but one of the coolest infographics I found was this one. Once they entered that last bit of data, the 3-D graph should look like a model of the ocean floor. Then they copied the graph and pasted into a Keynote to animate it. Keynote has a sharp-looking animation for graphs called “3-D grow.” The students used text boxes to label the different parts, and the final step (if we got to it, which we didn’t) would be to record a voiceover explaining each part of the ocean floor.


5th Grade Multiplying Decimals

multiplyformulasFifth grade students in Ms. Bailey’s class at Davis Elementary have been learning how to multiply decimals by two-digit numbers using paper and pencil (and sometimes calculators). Today I showed them how to write formulas in a Numbers spreadsheet that will do the same thing. This activity helps them break up the process into logical steps so they can see how it all works together. First I gave them a template that you can download by clicking here. They typed in a number of their choice with a decimal (to the hundreds place) and another 2-digit number to multiply by. Next I showed them how to write the first couple of formulas to multiply the ones digit in the bottom factor by different digits in the top factor. Once they got the hang of it, they were able to complete the rest of the formulas on their own. Then we wrote formulas for multiplying the tens digit of the bottom factor by each digit in the top factor. It was a great review of place value and the distributive property! The next step was to add up all the products to get the final answer. Finally, we wrote a formula multiplying the two numbers to check if it equaled the sum of all the products of the individual digits. It really seemed to click with the students. The only problem was, when they wrote a new number, they would have to rewrite all the formulas. So afterwards I came up with another activity that you can download by clicking here. It breaks up any number they write into place value digits (that was hard to figure out!). Then they can write formulas that will work with any number.


Tags:


3rd Grade Rounding Calculator

roundingcalcThird grade students in Ms. Wells’ class at Varina Elementary have been learning how to round numbers. I pointed out to them that their calculators can’t help with rounding because there is no rounding key. However, they can create their own rounding calculators using Numbers. I gave them a Numbers template that you can download by clicking here. The template guides the students through the process of creating formulas. The cool thing about teaching young children about formulas is it prepares them for the harder tasks of writing computer code and programming. It also gives students the opportunity to practice analysis and logical thinking skills because they have to figure out how to write the formulas and also how to debug the problems when they arise (which they inevitably do). First I explained how a spreadsheet is divided into columns and rows. Many 3rd graders are familiar with this concept because they learn about letter-number map grids (SOL3.5e). I instructed them to write any numbers they wish down column A. Next, in column B we wrote our first formula together to round any number to the tens place. I showed them how to drag the little white dot in the corner down the column to automatically fill in the other cells with the formula… and magically, all the numbers in Column A are rounded! You may think spreadsheets are boring, but when students see their formulas actually work, there is plenty of excitement! We do the formula for rounding to the hundreds place with a little less guidance from me. Finally they write the formula for rounding to the thousands place on their own.