Tag: GoogleDocs

Digital Citizenship Presentation

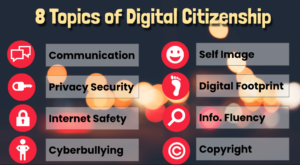
Our county is switching over from a digital citizenship curriculum that our team developed to Common Sense Media’s digital citizenship curriculum. It’s a great curriculum with lesson plans, videos, games, and activities. This week I have been giving presentations at each of my schools explaining how to use the new curriculum. First we said good-bye to the old curriculum, and then I went through the process for adapting the new curriculum. We discussed the eight topics of digital citizenship: communication, privacy security, internet safety, cyberbullying, self image, digital footprint, information fluency and copyright. You can take a look at my presentation here.


2nd Grade Thanksgiving Rounding

Second graders at Trevvett Elementary have been learning about Thanksgiving in Social Studies (SOL2.5h) and how to round two-digit numbers to the nearest ten in Math (SOL2.1d). Today students in Ms. Fletcher’s class created Google slideshows featuring Thanksgiving foods rounded to the nearest ten. First, we discussed their favorite Thanksgiving foods and why we might want to round the amounts. Rounding makes numbers easier to remember and use. It also helps with estimating. We reviewed how to round numbers down (if the ones place digit was 0, 1, 2, 3 or 4) and how to round numbers up (if the ones place digit was 5, 6, 7, 8 or 9). Then, we opened a blank Google slideshow and chose a theme. We typed a title and our name in the text boxes on the first slide, and I showed the students how to add another slide with the + button. We chose the “Big Number” slide template. In the smaller text box, the students typed a sentence telling how many items of a particular Thanksgiving food they had. They could choose any two-digit number they wanted, as long as it wasn’t already rounded. We typed the rounded number in the big text box. Since we wanted our classmates to solve our problems, I showed them how to add a transition to the number so it faded in later, revealing the answer only after the problem had been solved. Finally, we used the built-in Google image search to add a picture of the food. The students shared their slideshows on Schoology, but you can see them all here.


3rd Grade China & Egypt Multiplication

Third graders at Holladay Elementary have been learning about ancient Egypt and China in History (SOL3.2) and multiplication in Math (SOL3.4), so today students in Ms. Pumphrey’s class created multiplication problems about the inventions and contributions of these great civilizations. We began with a blank Google slideshow and chose a theme. Then they decided if they wanted to solve a problem about China or Egypt and included that in the title slide. On the next slide, we started building our multiplication problem. One concept that is often difficult for third graders to understand is that multiplication is really just multiple groups that are equal. To help them grasp this idea, I instructed them to make one group of objects from Egypt or China with a story explaining the grouping. For example, one family has three kites, or one piece of paper is made from seven papyrus plants, or one silk cloth is produced by ten silkworms. They typed a sentence and illustrated the group. Some students used a Google image search to find pictures, while others drew their own pictures using Kleki. On the next slide, the students made multiple groups by copying and pasting the one group. Then they asked the multiplication question, like, “How many kites do four families have?” or “How many silkworms would make five cloths?” On the final slide, students recorded the answer (you may want to leave the answer off, and let classmates solve each others’ problems). They shared their slideshows on Schoology, but you can see them all here.


2nd Grade U.S. Symbols Place Value

Second graders at Holladay Elementary have been learning about the U.S. symbols in History (SOL2.13) and how to calculate 10 or 100 more or less in Math (SOL2.1b). Today, students in Ms. Edmonds class created Google forms to review these concepts. First, each student chose a U.S. symbol to research (bald eagle, flag, Washington Monument, or the Statue of Liberty). They could use the Internet or books, and I instructed them to find a number related to their symbol. Some examples would be finding the height or weight of their symbol or identifying the number of objects on their symbol (stars, stripes, steps, etc.). Next, we went to our Google Drive and opened a New > Google Form. The students added a title, like, “Place Value.” Then they typed a problem to solve involving their symbol’s number and calculating 10 or 100 more or less. For the answer choices, they typed the right one and a few wrong ones. We discussed how to make the wrong choices tricky by thinking about common mistakes. If your question asks for 10 more, one of the wrong choices could be 10 less. I showed the students how to add an image of their symbol using the built-in Google image search. Finally, we went into settings and changed the form into a quiz, marked the correct answer, and shared the link on Schoology so our classmates could solve our problem. You can take a look at some student samples here.


3rd Grade Patterns and In-Out Boxes

Third graders at Varina Elementary have been learning how to identify, create, and extend patterns in Math (SOL3.16), so today students in Ms. Lanham’s class created patterns with Google Sheets. First, I gave the students a template to use that has fewer cells and a larger font size than Google’s default spreadsheet. Since this was the first time many of them had seen a spreadsheet, I explained that each row in a spreadsheet has a number, each column has a letter, and each cell is labeled with a combination of both (like A2 or C4). This is important to understand when it comes to writing formulas later. The top row usually has the column names, so I showed them how to highlight the row by clicking the number 1 on the left, and we made it all bold by clicking the Bold button in the toolbar. Then we typed the column names: In, Out, and Pattern. In-Out boxes are a great way to get students thinking about patterns because they focus on just two numbers (the number that goes “In” the box and the number that comes “Out”) and infer what happens inside the “Box.” The students typed a few random numbers in the first column. In the second column, they wrote simple formulas such as =A2+5 or =A3-3, and when they pressed “Enter,” they saw what came out of the “Box” they created. Some people may think spreadsheets are boring, but students get very excited when they see their formulas work. They especially enjoy this next trick to continue the pattern: click on a cell in the second column (one with a formula) and a blue box should appear; click and drag the bottom corner of the blue box across the rest of the row, and it automatically fills with the continued pattern! Finally, I showed the students how they could click the “Explore” button in the bottom right corner of the spreadsheet and choose their Formatting colors (or they could highlight rows and columns and make them whatever colors they wanted). We shared our spreadsheets on Schoology so their classmates could guess the patterns by typing a reply like, “Row 3 is +5.” You can see their spreadsheets here.


3rd Grade Habitat Word Problems

Third graders at Trevvett Elementary have been solving addition and subtraction word problems in Math (SOL3.3b) and studying habitats in Science (SOL3.6ab), so today students in Ms. L’Heureux’s class created their own habitat word problems with Google Drawings. First we reviewed several different habitats and the animals that live in them (desert, grasslands, rainforest, arctic, etc). Next we thought about what kind of number problems could happen in their ecosystem and whether they involved addition or subtraction: animals could have babies, animals could die, animals could migrate, etc. The students came up with some creative ideas! Then we went to Google Drive and opened Google Drawings (New > More > Google Drawings). We created a background by clicking the Shapes tool, selecting a square, and using the Paint Bucket tool to give it a solid or gradient fill color. To add the title, we clicked Insert > Word Art, typed the title, pressed Enter, and changed the font, fill and outline colors. Then the students used the built-in Google image search to find a picture of an animal in its habitat. Finally, they added a speech bubble from Shapes and typed their addition or subtraction word problem inside it. We shared the links to our drawings in Schoology so our classmates could solve them in the comments. You can try to solve some of them for yourself here. (UPDATE: I adapted this lesson using Google Slides instead of Google Drawings for other classes because we wanted to make the answer appear at the end. I added some of those examples to the document).


4th Grade Decimals Calculator

Fourth graders at Trevvett have been learning about decimals up to thousandths. They have learned how to compare decimals and round them (SOL4.3). Today, students in Ms. Cockrum’s class created their own decimals calculators with Google sheets. First, I asked if they knew of a calculator that could add or subtract decimals. They all did. Then I asked if they knew of a calculator that could compare or round decimals. None of them did, so they were very surprised when I explained that they would create a calculator that could do that. I pointed out that they would be coders today, and I wanted them to go through the same process that coders go through when creating a new program or app. Coders often start out with a flowchart to make sure that each step of the code is in the correct order. We discussed the steps a calculator would need to go through to compare two decimals. It would have to decide if one of the numbers was equal to (=), greater than (>) or less than (<) the other. Then it would have to display the correct symbol. A decision on a flowchart is usually a diamond shape, and the answer is either "yes" or "no." So our first decision could be, "Is A greater than B?" If the answer is "yes," the code would display a ">” symbol. If the answer was “no,” the code would continue to the next decision. The next decision might be, “Is A less than B?” and so on. The decisions could be in any order, but the final step isn’t really a decision, it would be a command to display the only symbol that was left. The shape for output in a flowchart is usually a parallelogram, but I told them they could use whatever shape they wanted. We used Google draw to make the flowcharts, then we opened this template in Google sheets to create the code. I instructed the students to type any decimal they wanted in the decimals columns. Then we wrote code, or formulas, in the other columns. Rounding is the easiest, so we started with that. I showed them the code for rounding to the ones place, then I let them figure out the code for rounding to the other places. The code for rounding a number in cell E2 is: ones place =ROUND(E2,0); tenths place =ROUND(E2,1); hundredths place =ROUND(E2,2). Next, we used our flowcharts to write the code for comparing decimals. If decimals are in cells A2 and C2, the code to display the symbol would go between them in cell B2. It may look something like this (but it could be in a different order):

=IF(A2 > C2,”>”, IF(A2 < C2,"<","="))

The students were excited to see their calculators working, and if they didn’t work, the students had to think critically and problem-solve to figure out the reasons. That’s actually one of the most valuable lessons of learning how to code. Our final step was to share the links to our spreadsheets on Schoology. You can see some samples from Ms. Cockrum’s class and Ms. Messer’s class (5th grade) here.


5th Grade Henrico Election Posters

Fifth graders at Trevvett Elementary have been learning about Henrico county government (HC.2) in Social Studies, and they’ve been identifying the main idea and summarizing nonfiction text in Language Arts (SOL5.6d,e). Since elections are coming up in November, students in Ms. Harris’s class and Ms. Brown’s class conducted research to find information about the candidates running for office in Henrico County. Then we summarized our findings to create campaign posters. First, we used this site to see the list of candidates. Each student chose a candidate they weren’t familiar with since many of them already had a family favorite, and I wanted them to be exposed to different viewpoints. Next, they did a Google search for their candidate and explored their campaign website. I showed them where to look to find the “Beliefs” or “Issues” sections. After the students read some of their viewspoints, we discussed ways to summarize their views into a couple of sentences for the campaign poster. Students could use Google Docs, Google Slides, or Google Drawings (as well as other tools like DesignCap) to make posters, but we chose to use Google Drawings since we hadn’t used that tool yet. For the poster’s background, we added a square shape, made it as large as the poster, and changed the fill color so it was a solid color or gradient. Then we clicked “Insert > Word Art” and typed the candidate’s name. I showed them how to change the font, fill, and outline color of the text. We imported a photo of the candidate using the Google image search feature. Finally, we added a speech bubble with the Shapes button and typed a summary of the candidate’s beliefs. We shared our campaign posters on Schoology, but you can see them all here.


5th Grade Plate Tectonics

Fifth graders at Varina Elementary have been learning about changes in the Earth’s crust due to plate tectonics (SOL5.7e). Today, students in Ms. Gallahan’s class used their analysis skills to look for correlations between a map of the Earth’s plates and a map of current earthquakes and volcanoes. First, they made a copy of a Google drawing template showing a map of the Earth’s plates (you can get your own copy here). Next, I showed them how to add a fancy title using Word Art (Insert > Word Art). I demonstrated how to change the size, font, fill color, and outline. Then we went to this site to see where there are current volcanoes and earthquakes. The students were surprised to see so many going on all over the world! We took a screenshot of the map with the Snipping Tool (on Chromebooks you can also use the Windows Key + Ctrl + Shift to take a screenshot). We pasted the screenshot into our Google drawing, and I showed them how to make it half transparent using the Format Options menu (Adjustments > Transparency). The tricky part was resizing the screenshot so the continents were the same size and matched up on both maps. Once they were aligned, it was easy to see some correlations. The volcanoes and earthquakes were happening along the plate boundaries! The plates map has arrows showing their movements, so we could figure out which ones were convergent, divergent, and transform boundaries. I instructed the students to get a shape from the Shapes tool, change its color, and type one or two of their discoveries and conclusions in the shape. Finally, we shared our posters in Schoology. You can see some of them here.


4th Grade Virginia Math Quizzes

Fourth graders at Varina Elementary have been learning about Virginia geography in Social Studies (VS.2) and rounding and place value in Math (SOL4.1). Today, students in Ms. Stevens’ class synthesized these concepts, along with research skills, to create Virginia Math quizzes using Google forms. First, I explained that we would be creating 1-question quizzes, but when we took each others’ quizzes, we would end up answering several questions. So their job was to create a really good question about place value or rounding that would make their classmates think. We reviewed types of questions they could ask: What is the value of the digit __? What number is in the __ place? How would you write this number in word form? What is this number rounded to the nearest ten thousand? Next, they had to do research to find a fairly large Virginia number. I showed them how they could use the microphone tool to audibly ask Google a question like: What is the population of Richmond? How tall is the tallest mountain in Virginia? How many chickens live in Virginia? How far is it from Roanoke to Arlington? How long is the James River? Once they had their number and a math question, we opened a blank Google form (New > More > Google Form), and they typed their question. I pointed out that their multiple choice answers should be tricky, based on errors that students typically make. For students who finished early, I showed them how they could change the theme of the form and add images. To turn their regular Google forms into self-grading quizzes, I demonstrated how to go to the gear icon at the top, click the Quizzes tab in the pop-up window, and change it to a quiz. Then, they had to mark the correct answer to their question. Finally, we shared the links to our forms on Schoology, and took each others’ quizzes. You can see them all here.