
5th Grade Tree Diagram Comics
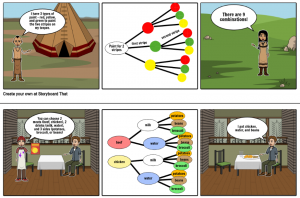 Fifth graders at Laburnum Elementary have been learning about probability (SOL5.15), and one strategy they use for figuring out all the possible outcomes is to make a tree diagram. So today, students in Ms. Burgess’ class created tree diagram comics with StoryboardThat. First, they logged into the site with their Google accounts and added a Scene to the first panel. Then they imagined different combinations of objects that would fit that scene (like foods at a restaurant or outfits at a party). They added some Characters and objects that matched their scenario. In the center panel, they constructed their tree diagram using Textables and Lines. We used Textables instead of Shapes so we could easily type inside of them. They started with one category (2 meats or 3 shirts, for example) and added additional categories to their tree. Two or three different categories are all that can fit in the panel space. To save time, I showed them how to copy and paste elements with the “Duplicate” button (it looks like two pieces of paper). Finally, in the last panel, they used the tree diagram or the Fundamental Counting Principle (multiplying by all the amounts in each category like 2 shirts x 2 pants x 3 shoes) to figure out the total possible outcomes. You can see a couple of sample projects here.