
3rd Grade Animated Food Chain Relationships
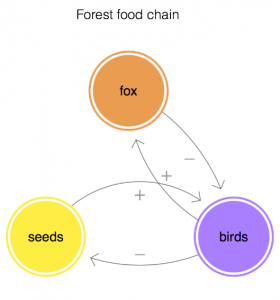 Third graders at Holladay have been learning about the relationships among organisms in aquatic and terrestrial food chains (SOL3.5), so today, students in Ms. Haley’s class created animations with Loopy to illustrate some of those relationships. First, we reviewed the different ecosystems: forest, desert, arctic, freshwater, ocean, etc. Then, students chose one ecosystem and typed the name of it in Loopy using the Text tool. Next, they used the pencil tool to draw a circle to represent a plant. If students didn’t know a plant that lived in their ecosystem, I showed them how to ask Google using the microphone. Next, students added an animal that eats that plant. Again, they could use Google for research. A great feature of Loopy is that it can show positive or negative relationships with arrows. We drew an arrow from the plant to the animal and discussed whether it should be positive or negative. It’s positive because more plants would mean more animals since they have a bigger food source. Then, we drew another arrow from the animal to the plant and made it negative (click the box in the upper right corner). It’s negative because more animals would mean less plants since they eat them. Students could continue adding animals to their web and using arrows to show the relationships between them. Finally, we pressed play and explored what happens when we change the population of each organism (by pressing the up or down arrows). We saved our animations as weblinks and shortened them with bitly. You can see them all here.