
4th Grade Battlefield Fractions
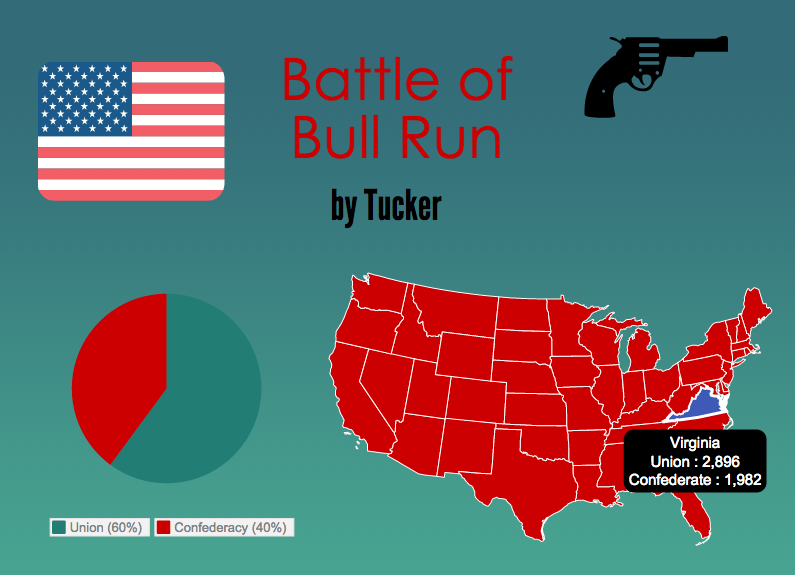 Fourth graders at Davis Elementary have been learning about the Revolutionary War and Civil War battles fought in Virginia (VS.5c & VS.7b). They have also been learning how to compare fractions (Math SOL4.2a). So today students in Ms. White’s class compared the fractions of casualties in each battle to determine which battle was Virginia’s greatest victory. First students chose a battle they wanted to research. We used Wikipedia to quickly find the number of casualties on both sides. Next we went to Piktochart to create an infographic to display our findings. I showed them how to choose a template, add a title, and change the font, size, and color. Next we added a map of the United States (under Tools). They had to erase the data that was already in the map and replace it with the battle casualties data. Then they changed the colors for Virginia and the rest of the map. After that we added a pie chart showing the casualties (students had to type the data again and change the colors). I pointed out that they should try to limit the colors in their infographics to three or four colors. Last, they added some icons (under Graphics) to decorate their infographics. Finally we posted our infographics to our Google classroom page, and our classmates estimated and compared the fractions shown in the pie charts using the comments section under each infographic. After analyzing the fractions, we determined Virginia’s greatest victory. Which battle do you think it was? Take a look at some samples here. If you would like additional information about this lesson, including the lesson plan, you can find it on our county’s Henrico21 website. UPDATE: I taught a similar lesson in Ms. Burcham’s class at Varina, and you can see their infographics here.