1st Grade Graphs
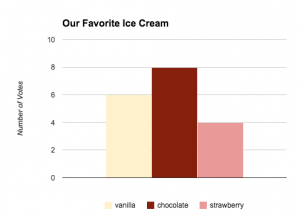
 First graders at Laburnum Elementary have been learning how to gather data by counting and tallying (SOL1.14) and how to display that data in graphs (SOL1.15), so today students in Ms. Tyler’s class practiced those skills using the computer. First we logged into their Google accounts (with lots of help) and went to Google classroom. I posted a question: “What is your favorite ice cream of these 3 choices: vanilla, chocolate, or strawberry?” The students clicked where it said “Add a comment” and typed their favorite flavor. They loved seeing their classmates’ names pop up. We counted how many students liked each flavor and wrote tally marks on the board. Next I posted a Google spreadsheet template to the classroom page and clicked the button “Make a copy for each student.” You can make a copy of the template to use with your class as well. The template has two tabs at the bottom. The first tab is the one the students will use. The tab labeled “Key” is a finished sample for your reference. I showed the students how to type the flavors in the first column (some of them needed help with that). Then they typed in the numbers. The graph will automatically build itself as the students type. We discussed what words we needed to add to the title and added “Ice Cream” to it. Finally I showed the students how to change the colors of the bars (click them and then click the paint bucket). That was all we had time for, but you could extend the lesson by asking questions like, “Which flavor had the most votes? the least?” Try graphing other favorites like colors, foods, animals, sports, etc.
