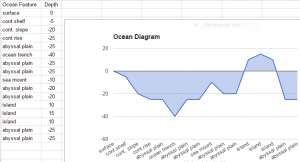
5th Grade Ocean Floor Diagram
 Fifth graders at Holladay Elementary have been studying the ocean (SOL5.6) in science, and they have been learning about line graphs in math (SOL5.15). So today Ms. Haislip’s students made line graphs of the Ocean Floor. First we had to collect our data. I showed them how they could use Google Earth to find the ocean depth at various spots. The goal was to take measurements at different places (the continental shelf, the continental slope, the continental rise, the abyssal plain, a sea mount, and a trench), and then enter that data into our spreadsheet. To save time, different groups of students could find a specific feature and share that measurement with the class. Next we opened a Google spreadsheet and wrote down the different features in the first column. We entered the depths in the second column. I explained that they would need to duplicate some of the measurements so that we would have a couple of points to plot (for example, the abyssal plain would need at least 2 equal points in order to make a straight line). Then I showed them how to make a line graph out of the data (it was actually an area graph so that it could be filled in with a color). I let them figure out how to adjust the data so that the resulting graph looked like the ocean floor. They learned the difference between negative and positive numbers very quickly! The final step was to customize the color and size and publish their graphs. I took screenshots using the snipping tool and posted them to CoMemories (which is a quick and easy way to share pictures). You can see their graphs here.
