Category: 4th Grade

4th Grade Animated Famous Virginians

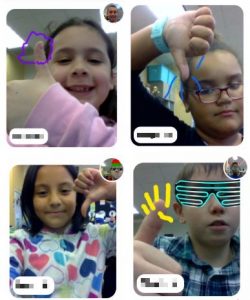
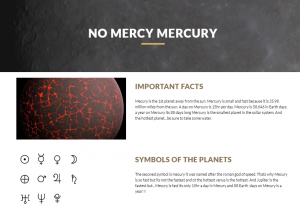
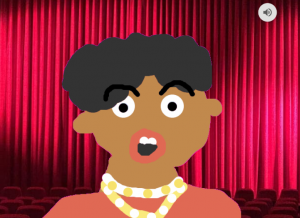
Fourth graders at Varina Elementary have been learning how to use online, reliable resources for research (SOL4.9), and they have been studying famous Virginians (VS.9). So today students in Ms. Belcher’s and Ms. Connell’s classes used this website to choose a famous Virginian and discover some interesting facts about them. Since we would be drawing our person, we did a Google image search for them to see what they looked like. We looked at their hairstyle, their clothing, and whether or not they wore glasses or facial hair. Next, we navigated to a great animation tool called BrushNinja. It’s free and doesn’t require a login. I explained that animation is basically a series of still pictures that are played one after another, kind of like the flip pages in Captain Underpants books. We drew our person on the first page, then duplicated the page several times and changed the mouth and the eyes in each image, so it looked like they were talking when we hit the play button. Before we exported our animation, we clicked the settings button at the top (the gear icon) to remove the background and slow down the frames per second. Then we saved our animation as a GIF file. The second step was to record audio of the person telling about their accomplishments using another great, easy-to-use web tool called Vocaroo. We downloaded the recording as an MP3 file. The final step was to combine the animation and the audio into a Google slides presentation. A new feature of Google slides is the ability to add sounds, but you have to save the MP3 files in a shared Google folder. I showed the students how to create a folder in their Google drive, share it, and upload the MP3 file into it. Finally, we made a Google slide, added a background image that related to our person, and uploaded the animation and sound files. They turned out really great! You can see them all here.


4th Grade Parade Floats

Our local high school is going to put on a parade this summer, so the fourth graders at Trevvett Elementary have been tasked with designing the float for their school. They asked me to help them develop prototypes, and then they would vote on the best one to actually build. I decided to show them Tinkercad because they could create 3-D models of their float ideas and print them on the 3-D printer. First, we discussed parades and floats they had seen before. What made a float memorable? How do you think they were constructed? I showed them this slideshow with sample floats for inspiration. The theme for our school’s float is “Creativity,” one of the HLP categories we have been focusing on this year. How do these sample floats showcase creativity in their materials and design? Next, we went to Tinkercad and I explained how to use the tools, modify the 3-D shapes, and make holes and text. They have been learning about solid geometric figures in Math (SOL4.11), so we identified the various shapes as we used them. After the students designed their floats, they took screenshots of them, and shared them in a Schoology gallery. You can see some of their designs here.


Tags:


4th Grade Battlefield Perimeter & Area

Fourth graders at Trevvett Elementary have been learning about perimeter and area in Math (SOL4.7) and Civil War battles in History (VS.7b). Today students in Ms. Reed’s class used Google Maps to find the perimeter and area of Manassas Battlefield, where the Battle of Bull Run was fought in 1861. It was the site of the first major battle of the Civil War, and it’s now a national park. First, we explored it with regular Google maps so we could take a virtual field trip there. We turned on satellite view (bottom left corner) and clicked the yellow guy in the bottom right corner (also known as Pegman). When you click on him, you will see blue lines and blue dots. The blue lines show street view, but the blue dots give you a 360 degree view of those sites. Sometimes they are even inside of buildings and museums! So Pegman is a fantastic way to take virtual field trips (TIP: Try dragging Pegman over Hawaii or Nevada, and see what he turns into)! After exploring the battlefield in Google Maps, I asked the students to estimate its perimeter and area. I explained that in the next step we would actually measure its perimeter and area and see whose estimate was closest. My Google Maps is a great way to create, customize and save your own maps. To get started, we clicked the red button “Create a new map.” In the search box we typed “Manassas Battlefield” and arrived at the site. Then I showed them how to use the drawing tool to outline the battlefield. It took a bit of practice, but once the outline was complete, we gave it a title, typed a description, added a photo or two, and hit the Save button. When we clicked back on the outline, a box popped up with some cool features. We could change the outline and fill color with the paint bucket, but more importantly, it told us the area and perimeter of the outline! To finish the project, we clicked the Share button, changed the settings so anyone with the link could view the map, copied the link, and pasted it into Schoology. The students also typed the perimeter and area into the comments so they could compare their findings with their classmates’. You can see some of their maps and comments here.


5th Grade Figurative Language & Force Animations

Fifth graders at Varina Elementary have been learning about figurative language (SOL5.4d) and force and motion (SOL5.3). Today, students in Ms. Messer’s class created animations with BrushNinja to illustrate different types of force and motion. Their animations showed pushing, pulling, speed, collisions, kinetic energy, and the effects of friction. They exported their creations as animated GIFs, then uploaded them to Schoology to share with their classmates. Along with their post, I encouraged them to type a sentence about their animation that included figurative language such as exaggeration (hyperbole), personification, similes, or metaphors. Later, I compiled their animations and sentences into a Google slideshow that you can see here.


4th Grade Probability Spinners

Fourth graders at Varina Elementary have been learning about probability (SOL4.13) and graphing (SOL4.14), so today students in Ms. Connell’s class created probability spinners and graphed the results. First, they chose a topic for their probability spinner, such as sports, animals, shoes, colors, games, foods, etc. Next, they opened a Google sheet and typed a list of items that belong with that topic in Column A (for example, if they chose sports, they might type baseball, soccer, football, basketball, etc.). I instructed them to list some items more than others to increase the probability for those items. Then we copied all of Column A and went to WheelDecide, which is a free, customizable, online spinner. We clicked the “Paste List” button and pasted our list into the box. Now we have a spinner with all our items on it. Back in our spreadsheet, in Column B, we predicted whether it would be “Likely” or “Unlikely” for each item to be selected by the spinner. Of course, multiple items would be more likely. We tested our predictions by spinning the spinner 24 times and tallied the results. Finally, we recorded the results in Column C of our spreadsheet and clicked the “Insert Chart” button to generate a bar graph of our data. You can see the students’ spinners and spreadsheets here.


4th Grade Force & Motion Animations

Fourth graders at Laburnum Elementary have been learning about force and motion in Science (SOL4.2). Today, students in Ms. Wolinski’s class created animations to illustrate these concepts. In the past, we have used ABCYa! Animate for animation projects, but today we used a more advanced tool called Wick. I like Wick because you can move each individual part of your drawing, so it makes the process of creating an animation a lot easier. First, we acted out different types of force, motion, and energy, including kinetic and potential energy, to get ideas for our projects. Potential energy is a difficult concept to understand, so we explored examples like pulling back on a bowstring, taking a deep breath before blowing up a balloon, raising a hammer, pressing your fingers together in preparation to snap, pulling your arm back to throw a ball, etc. For each example, we thought of ways to increase the potential energy–pulling back further or pressing harder or lifting higher. Now that we had some ideas, we launched the Wick editor. I demonstrated how to illustrate the first frame of their animation using the paint tools. Then I showed them how to duplicate the frame and move different parts of the drawing in small increments on each subsequent frame. If there is too drastic of a change in the position of the objects, the animation looks jarring instead of smooth. The students continued duplicating and manipulating their frames until they had an animation that illustrated force and motion. Our animations were a bit too fast though, so I explained how to slow them down by going to the Project Settings (the gear icon in the top right corner) and changing the frame rate. Finally, we clicked File > Export Animated GIF and uploaded our finished animations to Schoology. You can see some student samples here. UPDATE: I taught a similar lesson with Ms. Stevens’ class using another animation app, Brush Ninja, and added those to the project page.


4th Grade Flipgrid Debate

Fourth graders at Trevvett Elementary have been studying life in colonial Virginia (VS.4), and they have been learning how to conduct research (SOL4.9) and express an opinion supported by facts (SOL4.7j). Today we reviewed and practiced these concepts with a Flipgrid Debate. Knowing how to have a civil debate is an important citizenship skill which can be taught, even in elementary school. This article in Edutopia explains how oracy, or speaking well, can serve our students for the rest of their lives. Oral communication is the first of the English SOLs for every grade (K.1, 1.1, 2.1, etc.), but we are often at a loss for how to teach it. Voice21 provides great resources and rubrics for teaching oral communication to elementary students. I will be presenting on this topic at VSTE2018 if you’d like to learn more about it. My presentation is here. One fun, unstressful way for students to practice public speaking is to record videos, which is why we are using Flipgrid. Most of them have their favorite YouTubers, so they have some background knowledge about good public speakers. We discussed how those YouTubers speak with enthusiasm and expression and share interesting information. Then I gave the students a debate topic: “Life in Colonial Virginia was better than life in modern Virginia.” I explained that they would choose a side, pro or con, and defend their position with facts. We spent a few minutes researching facts about colonial Virginia on the Internet. Students copied the URL for the website they found most useful. Then, when we recorded our videos in Flipgrid, they clicked the button for attaching links, and pasted in the URL as a citation. Some of the sites the students found were: 1, 2, 3, 4, and 5. Flipgrid videos use snapshots for the video thumbnails, so I instructed students to show their pro or con position visually in the snapshot with an emoji or thumbs up or down. Next, they had to find someone who held an opposing position, listen to their argument, then record a counterargument as a reply. We reviewed ways to disagree politely and with a respectful attitude. Even though this was their first debate, they did a great job! You can take a look at their videos here.


Tags:


4th Grade Planets Websites

Fourth graders at Holladay Elementary have been studying the planets of the solar system and their relative sizes (SOL4.7)–always a favorite topic for 4th graders. Today, students in Ms. Anthony’s class created their own planets websites with Google Sites. First, the students chose a planet to research. They could use books or the Internet. A few great sites for solar system research are: (1) ESA Kids (basic facts about each planet, easiest to read); (2) NASA (interactive 3D solar system, compare planets’ sizes); (3) Solar System Scope (interactive 3D solar system, explore planets’ interiors with cut-away diagrams); and (4) Star Atlas (shows which planets you can see in the sky tonight). One interesting fact we learned from our research was the the symbols for male and female came from the ancient symbols for Mars and Venus. After the students gathered the facts they found interesting, they opened a new Google Site via their Google Drive (New > More > Google Sites). They typed a creative title, changed the header image, and selected a theme. Then I showed them how to choose a layout and add images and text. They worked hard writing complete sentences, using their own words. When they finished, they clicked the “Publish” button, copied the link, and shared their planet website with their classmates on Schoology. You can take a look at all their websites here.


4th Grade Decimals Calculator

Fourth graders at Trevvett have been learning about decimals up to thousandths. They have learned how to compare decimals and round them (SOL4.3). Today, students in Ms. Cockrum’s class created their own decimals calculators with Google sheets. First, I asked if they knew of a calculator that could add or subtract decimals. They all did. Then I asked if they knew of a calculator that could compare or round decimals. None of them did, so they were very surprised when I explained that they would create a calculator that could do that. I pointed out that they would be coders today, and I wanted them to go through the same process that coders go through when creating a new program or app. Coders often start out with a flowchart to make sure that each step of the code is in the correct order. We discussed the steps a calculator would need to go through to compare two decimals. It would have to decide if one of the numbers was equal to (=), greater than (>) or less than (<) the other. Then it would have to display the correct symbol. A decision on a flowchart is usually a diamond shape, and the answer is either "yes" or "no." So our first decision could be, "Is A greater than B?" If the answer is "yes," the code would display a ">” symbol. If the answer was “no,” the code would continue to the next decision. The next decision might be, “Is A less than B?” and so on. The decisions could be in any order, but the final step isn’t really a decision, it would be a command to display the only symbol that was left. The shape for output in a flowchart is usually a parallelogram, but I told them they could use whatever shape they wanted. We used Google draw to make the flowcharts, then we opened this template in Google sheets to create the code. I instructed the students to type any decimal they wanted in the decimals columns. Then we wrote code, or formulas, in the other columns. Rounding is the easiest, so we started with that. I showed them the code for rounding to the ones place, then I let them figure out the code for rounding to the other places. The code for rounding a number in cell E2 is: ones place =ROUND(E2,0); tenths place =ROUND(E2,1); hundredths place =ROUND(E2,2). Next, we used our flowcharts to write the code for comparing decimals. If decimals are in cells A2 and C2, the code to display the symbol would go between them in cell B2. It may look something like this (but it could be in a different order):

=IF(A2 > C2,”>”, IF(A2 < C2,"<","="))

The students were excited to see their calculators working, and if they didn’t work, the students had to think critically and problem-solve to figure out the reasons. That’s actually one of the most valuable lessons of learning how to code. Our final step was to share the links to our spreadsheets on Schoology. You can see some samples from Ms. Cockrum’s class and Ms. Messer’s class (5th grade) here.


4th Grade Virginia Math Quizzes

Fourth graders at Varina Elementary have been learning about Virginia geography in Social Studies (VS.2) and rounding and place value in Math (SOL4.1). Today, students in Ms. Stevens’ class synthesized these concepts, along with research skills, to create Virginia Math quizzes using Google forms. First, I explained that we would be creating 1-question quizzes, but when we took each others’ quizzes, we would end up answering several questions. So their job was to create a really good question about place value or rounding that would make their classmates think. We reviewed types of questions they could ask: What is the value of the digit __? What number is in the __ place? How would you write this number in word form? What is this number rounded to the nearest ten thousand? Next, they had to do research to find a fairly large Virginia number. I showed them how they could use the microphone tool to audibly ask Google a question like: What is the population of Richmond? How tall is the tallest mountain in Virginia? How many chickens live in Virginia? How far is it from Roanoke to Arlington? How long is the James River? Once they had their number and a math question, we opened a blank Google form (New > More > Google Form), and they typed their question. I pointed out that their multiple choice answers should be tricky, based on errors that students typically make. For students who finished early, I showed them how they could change the theme of the form and add images. To turn their regular Google forms into self-grading quizzes, I demonstrated how to go to the gear icon at the top, click the Quizzes tab in the pop-up window, and change it to a quiz. Then, they had to mark the correct answer to their question. Finally, we shared the links to our forms on Schoology, and took each others’ quizzes. You can see them all here.